BackgroundThe study of bone health in
younger individuals is less explored than in older populations but may offer
insights into preventing future bone conditions.
ObjectivesThis study analyzes the
link between bone quality and energy drink consumption while considering
factors like physical activity and body composition.
Sample and MethodsThe sample
comprised 911 Slovaks, male and female, aged 18–30 (21.53 ± 2.27). Bone
mineral density was measured using a quantitative ultrasound device
(Sunlight MiniOmni™), yielding speed of sound (SOS; m/s) data. Body
composition variables, including Lean Body Mass (LBM; kg) and Percent Body
Fat (PBF; %), were assessed with the bioimpedance analyzer InBody 770.
Additional behavioural factors were gathered via a questionnaire based on
the WHO Steps 2014.
ResultsSex was found to be a
significant predictor of SOS [F(11,899 = 4.01), p < 0.001, R2 = 0.047],
with females showing higher SOS than males (p < 0.001), whereas physical
activity (p = 0.594) was not a significant predictor. Although energy drink
consumption did not show a direct impact on SOS according to the Saint
Nicholas House Analysis (SNHA), it was a significant predictor in those who
drank 1–2 days/week (p = 0.009) and those who drank less than once a month
(p=0.023) with these individuals exhibiting lower SOS than non-consumers,
thus poorer bone tissue quality.
ConclusionIn summary, energy drinks
consumed 1–2 days/week and less than once a month are associated with bone
tissue quality in young adults, albeit not directly posing a potential
adverse effect on bone health.
Keywords: Bone mineral density, physical activity, energy drinks, quantitative ultrasound, bioimpedance analysis
Conflict of interest statement:
There are no conflicts of interest.
Citation: Sulis, S. et al. (2025). Association between
frequency of energy drink consumption and bone tissue quality in Slovak young
adults. Human Biology and Public Health 1. https://doi.org/10.52905/hbph2025.1.91.
Sex and lifestyle significantly influence bone tissue in young adults. While
energy drink consumption is linked to lower bone quality, no direct causal
relationship was found. Recognizing these factors early may help guide
strategies for preventing future bone health issues. Further research on
nutritional impacts is needed.
Abbreviations
BCM : Body cell mass
BC : Body composition
BMI : Body mass index
BMD : Bone mineral density
DBP : Diastolic blood pressure
DXA : Dual-energy X-ray
absorptiometry
EDC : Energy drink consumers
Non-EDC : Energy drink non-consumers
FFM : Fat free mass
FFMI : Fat free mass index
FM : Fat mass
FMI : Fat mass index
LBM : Lean body mass
mPhM : Medium-intensity physical
activity
mQUS : Multisite quantitative
ultrasound
MM : Muscle mass
PBF : Percent body fat
QUS : Quantitative ultrasound
SMM : Skeletal muscle mass
SOS : Speed of sound
SBP : Systolic blood pressure
WHR : Waist-to-hip ratio
Contents
Introduction
Energy
drink use is becoming increasingly common worldwide, especially among the younger
generations and athletes (Kaur et al. 2022; Reissig et al. 2009). It was reported in the
university student population that those who performed physical activity were
significantly more likely to consume energy drinks (Pavlovic et al. 2023); this behaviour was also found in association with short
sleep duration and high intake of fast food and snacks (Nuss et al. 2021; Poulos and Pasch 2015). The
ingredients and concentrations in such drinks vary broadly by brand and product;
however, most share a few common ingredients, such as caffeine, taurine, sucrose, and B
vitamins (Higgins et al. 2018; Higgins et al. 2010). Concerns have been raised about their safety
owing to potential adverse effects, namely sleeping disorders, anxiety, cardiovascular
events, and seizures (Puupponen et al. 2023; Somers and Svatikova 2020). As a result of the
variable composition of this drink category, most of the studies analyze the effect on
the bone of the individual ingredients, such as caffeine, which can be up to 141mg in a
250ml can (Nowak and Jasionowski 2015) and not on
energy drinks in general.
Caffeine appears to affect bone density at a molecular
level by intensifying osteoclastic differentiation and acting as a non-specific
antagonist of adenosine receptors, inhibiting bone formation and promoting bone
resorption (Berman et al. 2022; Liu et al. 2011). To the best of our knowledge, although studies
have examined the effects of carbonated soft drinks and cola beverages on bone tissue,
there appears to be a lack of research specifically on the impact of energy drinks on
bone tissue in young adults. Animal studies have provided some insights into these
effects. A study on 24 adult female albino rats using soft drinks like Coca-Cola and 7up
over four months revealed adverse effects on bone tissue (AL-Hadrawy and Jawad 2022). The findings demonstrated a significant increase in
serum calcium and inorganic phosphorus levels and a decrease in magnesium and vitamin D3
concentrations after two weeks. Additionally, soft drinks were found to have detrimental
impacts on the bone’s histological structure. Research has also noted significant
increases in alkaline phosphatase, osteocalcin, and bone sialoprotein, which are
responsible for disrupting the balance between new bone formation and bone resorption.
Furthermore, Birlik et al. (2017) investigated the
effects of energy drinks on the expansion of the median palatal suture in the maxilla of
twenty male rats. Ten of these rats were administered a daily dose of 3.57ml/kg of an
energy drink primarily containing caffeine and taurine. However, the study found that
consuming small amounts of caffeine daily did not influence bone formation. Studies show
mixed results when transitioning to human research. Similarly, heel bone density
measured using dual-energy X-ray absorptiometry (DXA) in 740 girls aged 12 and 15 years
was lower in carbonated soft drink consumers (McGartland
et al. 2003). In contrast, Conlisk and Galuska (2000) did not find a significant interaction between coffee and
caffeine-containing drinks (coffee, tea, and caffeinated cola) and bone density measured
in the lumbar spine and femoral neck with DXA in 177 women aged
19–26.
Additionally, bone fragility and fracture risk assessments are mainly
evaluated via bone mineral density (BMD) measured using DXA. However, recent studies
indicate that DXA-derived BMD inadequately predicts fracture resistance in both adults
and children (Docaj and Carriero 2024), with multisite
quantitative ultrasound (mQUS) emerging as a non-invasive diagnostic tool that measures
bone speed of sound (SOS) to evaluate bone health, being able to identify aspects of
bone quality aspects not detectable by DXA, such as elasticity and trabecular
microarchitecture (Dane et al. 2008; Kaufman and Einhorn 1993; Weiss
et al. 2003). Furthermore, DXA exposes patients to low levels of ionizing
radiation, yields higher costs and requires specialized personnel to operate it. Whereas
the disadvantages of QUS include the reduced spatial resolution compared to DXA and
inconsistent results due to variations in operator technique and measurement
locations.
Energy drink consumption by athletes is a topic of great interest due
to the possible impacts on their health and performance. Studies indicate that athletes
who drink energy drinks experience improved focus and performance during both anaerobic
and aerobic exercises (Correa-Rodríguez et al. 2018; Tambalis 2022). While some studies suggest that
consuming energy drinks in moderate amounts can improve athletic performance (Gutiérrez-Hellín and Varillas-Delgado 2021),
high-dose intake may result in reduced performance and increased oxidative stress (Wang et al. 2022). Moreover, research indicates that
individuals who engage in physical activities, including young adults, generally adopt
healthier dietary patterns. A study by Watts et al. (2018) found that young adults who regularly practised yoga consumed more fruits
and vegetables, drank fewer sugar-sweetened beverages, ate fewer snack foods and fast
food, and participated in more hours of moderate-to-vigorous physical activity.
Furthermore, Mazurek-Kusiak et al. (2021) observed
that active individuals exhibited superior eating habits compared to their sedentary
counterparts. Physical activity’s effect on BMD varies mainly on the type of sport,
intensity, and frequency; however, as a result of sedentary behaviours, there is a
reduction of weight-bearing loads on the bone tissue, leading to alterations in bone
turnover (McMichan et al. 2021). Therefore, this study
aimed to investigate if SOS obtained from QUS depends on energy drink consumption,
specifically if lower SOS is observed in those who consume energy drinks compared to
those who do not, with adjustments in the regression analysis for behavioural factors
such as physical activity and body composition.
Sample and methods
Sample
A sample of 911 young Slovaks (284 males, 627 females), all
aged 18 to 30 (21.53 ± 2.27) years, was investigated. The participants were mainly
university students recruited via non-random volunteer and convenience procedure at the
laboratory of the Department of Anthropology, Comenius University in Bratislava. The
Ethics Committee of Comenius University Bratislava, protocol number ECH19021, approved
the sample collection and analyses. Written informed consent was given by all
participants per institutional Human Investigation Committee guidelines following the
Declaration of Helsinki amended in October 2013, after information about the procedures
used in the experiments. From the original sample of 1006, those with invalid QUS
measurements (n = 58) and missing body composition data were excluded; no other
exclusion criteria were applied.
Anthropometric analysis
and blood pressure measurement
Anthropometric measurements were obtained by
trained anthropologists using internationally recognized methodologies (Lohman et al. 1988). Height was measured precisely to the nearest
0.5cm using a Siber and Hegner anthropometer, with participants positioned upright, with
their feet together, against a wall. The integrated weight scale of InBody 770 precisely
measured the body mass to the nearest 0.1kg. A tape measure, Seca 201 (Seca GmbH &
Co. KG, Germany) was used to obtain hip and waist circumferences with the participants
standing upright and relaxed, their feet together, and their arms crossed in front of
their chests. Waist circumference was measured at the narrowest part of the abdomen
without compressing the tissue at the end of the normal exhalation. The hip
circumference was measured by placing a tape measure on the maximum circumference of the
buttocks. Body mass index (BMI) is calculated by dividing an individual’s body mass (kg)
by the square of their height (m2). Waist-to-hip ratio (WHR) is calculated by dividing
the circumference of an individual’s waist by the circumference of their hips; values
less than 0.84 for women and less than 0.89 for men were considered optimal (WHO 2000).
Lastly, blood pressure (mmHg) and
heart rate (BPM) were measured with a digital sphygmomanometer (Omron M3) three times;
in the present study, the mean value of the three measurements was used (Souchek et al. 1979).
Body composition analysis
Body composition
analysis was evaluated with the InBody 770 analyzer (Biospace Co., Ltd., Republic of
Korea), which utilizes segmental multifrequency bioelectrical impedance analysis to
evaluate body composition by transmitting low-level electrical currents through the body
and assessing resistance in various tissues. The instrument evaluates lean body mass
(LBM) and fat mass (FM) for the entire body, trunk, and arms in both percentage and
kilograms, visceral fat mass in squared centimeters, percent body fat (PBF), skeletal
muscle mass (SMM), and fat free mass (FFM) in kilograms. The values expressed as
percentages represent the ratio of an individual’s body composition measurement to the
mean value for subjects of equivalent height and sex, as derived from reference data (Arman 2021). Hurt et al.’s research (2021) compares the Dual-energy X-ray Absorption (DXA) method with
the InBody 770 body composition analyzer. The validation studies reveal a high 98%
correlation between these two techniques, highlighting the InBody 770 as a dependable
substitute for DXA in measuring body composition. Measurements were conducted under
controlled conditions to ensure accurate results, with participants refraining from
engaging in physical activity for eight hours before the measurement, abstaining from
significant water and food intake for three hours prior to the examination, standing
barefoot on the pedal plate electrode, and holding the hand electrode at a 15° angle to
avoid arm-to-torso contact (National Institutes of Health
1996; Arman 2021).
Bone quality measurement
The BMD
data were collected utilizing a quantitative ultrasound device, specifically the
Sunlight MiniOmniTM (BeamMed Inc., Israel) on the distal third of the left
radius, measured at the midpoint between the elbow at the olecranon process of the ulna
and the end of the distal phalanx of the digitus medius, using an ultrasound gel and
repeating the measurements three to five times. Based on its operational design, the
instrument determines the number of SOS measurements, typically ranging from 3 to 5. The
built-in software automatically generates the final results without providing individual
measurement data. Before each data collection day, the instrument was calibrated. The
instrument measured the SOS [m/s], with higher values associated with increased bone
density.
Questionnaire
Data
regarding physical activity and energy drink consumption were collected by administering
to the participants an extensive self-reporting, standardized and validated
questionnaire adapted from the World Health Organization (WHO) STEPS 2016 – instrument
version 3.2 (WHO 2016), which focused on medical
history, diet, and behaviours such as physical activity. Energy drink, tea, coffee, and
sweetened drink use was ascertained by asking the participants how often they consume
these beverages; similarly, for physical activity, it was asked how often they practice
sports, with the following options as replies: daily, 5–6 days/week, 3–4 days/week, 1–2
days/week, 1–3 days/month, less than once a month, and lastly, not at all. Individuals
who reported consuming energy drinks were categorized as energy drink consumers (EDC),
regardless of the frequency of the consumption. In contrast, those who indicated they
did not consume energy drinks at all were categorized as energy drink non-consumers
(non-ECD). A yes or no question evaluated medium and intense physical activity. For
medium intensity physical activity, the question was “Do you do any moderate-intensity
sports, fitness or leisure activities (e.g., fast walking, swimming, volleyball) for at
least 10 minutes that cause your breathing and heart rate to increase?”, for intense
physical activity “Do you do any intense sports, fitness or recreational activities that
cause you to constantly have a major increase in breathing or heart rate (e.g., running,
football) for at least 10 minutes?”.
Statistics
A p-value threshold of < 0.05 was used to determine statistical
significance. Descriptive statistics, including the Student’s t-test and Mann-Whitney U
test, were used based on the data distribution assessed with the Kolmogorov-Smirnov
test. Spearman’s rho and Pearson’s correlation were used for correlation analysis
between continuous variables to establish potential interactions between SOS and health
conditions, such as the number of fractures, thyroiditis, Crohn’s disease, liver
conditions, diabetes type 1, eating disorders, epilepsy, oncological pathologies, and
celiac disease; however, no significant correlations were found. Principal component
analysis (PCA) was used to select the most relevant body composition and behavioural
variables. Forward linear regression analysis was used to analyze the predictors, such
as diastolic blood pressure (DBP), PBF, LBM, physical activity, sex, and energy drink
consumption of SOS. St. Nicolas House Analysis (Groth
et al. 2019) was used to visualize and detect the interactions among the
variables under the study. Chi-square tests and a bar plot were used to investigate the
relationship between energy drink consumption and physical activity.
The data were
analyzed using jamovi (version 2.3.21) and R (4.4.1 - Package snha (Groth 2023)).
Results
The baseline characteristics of male students divided into EDC (n = 157)
and non-EDC (n = 127) are illustrated in Table 1. It
includes the bone parameter SOS 4025.59±120.81 (m/s) in EDC and SOS 4028.53±110.92 (m/s)
in non-EDC, as well as body composition parameters such as FFM, LBM, SMM, PBF, FM in the
arm, LBM in the arm, visceral fat mass, blood pressure, and heart rate. Statistically
significant differences between the two groups were observed in the following variables,
heart rate (p = 0.005), FFM (p = 0.035), LBM (p = 0.048) and LBM in the arm (p =
0.032).
Table 1 Baseline body composition and bone quality
characteristics of energy drink consumers and non-consumers of male Slovak young
adults
Energy drink consumers (n = 157)
Energy drink non-consumers (n =
127)
Mean
SD
Mean
SD
p
Age
21.93
2.26
22.44
2.51
0.073
Height (cm)
180.87
7.10
180.15
7.18
0.396
Body mass
(kg)
78.98
11.94
77.45
15.71
0.353
SOS (m/s)
4025.59
120.81
4028.53
110.92
0.833
BMI (kg/m²)
24.10
3.05
23.81
4.22
0.496
WHR
0.81
0.05
0.80
0.04
0.415
SBP (mmHg)
133.71
13.32
132.22
12.70
0.339
DBP (mmHg)
70.29
8.82
71.60
8.40
0.202
Heart rate
(BPM)
77.83
14.03
73.34
12.24
0.005*
FFM (kg)
64.72
8.08
62.55
9.12
0.035*
LBM (kg)
61.44
7.60
59.54
8.46
0.048*
SMM (kg)
36.92
4.78
35.85
5.88
0.093
PBF (%)
17.19
6.76
17.75
7.49
0508
FM arm (%)
116.87
104.75
136.22
194.96
0.286
LBM arm (%)
104.10
10.69
101.33
10.81
0.032*
Visceral FM
(cm2)
58.54
36.40
60.02
42.05
0.751
* Marks statistical significance p < 0.05
Abbreviations: n, number of individuals; SD, standard deviation; SOS, Speed of
sound; BMI, Body mass index; WHR, Waist to hip ratio; SBP, Systolic blood
pressure; DBP, Diastolic blood pressure; FFM, Fat free mass; LBM, Lean body
mass; SMM, Skeletal muscle mass; PBF, Percent body fat; FM, Fat mass.
Similarly, baseline characteristics of female students divided into energy drink
consumers (EDC; n = 205) and energy drink non-consumers (non-EDC; n = 422) are
illustrated in Table 2, including the bone parameter
SOS 4050.29 ± 127.41 (m/s) in EDC and SOS 4080.28 ± 104.76 (m/s) in non-EDC as well as
body composition parameters, blood pressure, and heart rate. Statistically significant
differences between the two groups were observed only in the variable SOS (p = 0.002).
Nevertheless, the practical significance of this 30m/s variation is unclear, as it falls
within the scope of technical variability and may not significantly affect bone health
in young, healthy subjects.
Table 2 Baseline body composition and bone quality
characteristics of energy drink consumers and non-consumers of female Slovak
young adults
Energy drink consumers (n = 205)
Energy drink non-consumers (n =
422)
Mean
SD
Mean
SD
p
Age
21.11
2.11
21.31
2.19
0.265
Height (cm)
167.38
6.09
166.44
6.17
0.073
Body mass
(kg)
61.75
11.40
60.28
10.67
0.114
SOS (m/s)
4050.29
127.41
4080.28
104.76
0.002*
BMI (kg/m²)
22.00
3.70
21.74
3.54
0.384
WHR
0.75
0.07
0.74
0.05
0.086
SBP (mmHg)
118.01
14.61
117.36
11.69
0.546
DBP (mmHg)
69.86
7.09
69.64
8.50
0.753
Heart rate
(BPM)
79.75
13.09
79.95
13.09
0.858
FFM (kg)
43.91
5.31
43.22
5.40
0.133
LBM (kg)
41.57
5.07
40.95
4.82
0.136
SMM (kg)
24.05
3.17
23.69
3.03
0.166
PBF (%)
27.72
7.37
26.84
7.26
0.154
FM arm (%)
126.07
76.04
118.06
68.44
0.186
LBM arm (%)
95.55
9.64
95.16
8.99
0.615
Visceral FM
(cm2)
78.80
41.40
73.43
38.08
0.108
* Marks statistical significance p < 0.05
Abbreviations: n, number of individuals; SD, standard deviation; SOS, Speed of
sound; BMI, Body mass index; WHR, Waist to hip ratio; SBP, Systolic blood
pressure; DBP, Diastolic blood pressure; FFM, Fat free mass; LBM, Lean body
mass; SMM, Skeletal muscle mass; PBF, Percent body fat; FM, Fat mass.
Descriptives conducted on the frequency of physical activity show that 50 (5.52%)
individuals practised sports daily (SOS 4051.78±102.55m/s), 69 (7.62%) practised 5–6
days/week (SOS 4040.90 ± 110.16m/s), 218 (24.09%) practised 3–4 days/week (SOS
4053.25±138.82 m/s), 336 (37.13%) practised 1–2 days/week (SOS 4054.82 ± 107.93m/s), 95
(10.50%) practised 1–3 days/month (SOS 4074.74 ± 116.75m/s), 37 (4.09%) less than once a
month (SOS 4086.05 ± 122.82m/s) and lastly, 100 (37%) not at all (SOS 4054.41 ±
94.14m/s), bone quality however did not show to be significantly affected by the
frequency of engagement in physical activity (p = 0.416)
In order to reduce the
number of variables and capture most of the variance in the data, a PCA was performed
(Table 3). This analysis provided five components, the
first associated with variables related to skeletal muscle mass (SMM) and LBM but
negatively associated with sex (-0.877); although not with the highest value, the sex
variable suggests that this component might distinguish between male and female body
composition (BC); component two represents FM distribution; component three, mainly
associated with diastolic blood pressure (0.858); component four, reflects levels of
physical activity and component five, dietary habits.
Table 3 Principal component analysis of body
composition, anthropometric, and lifestyle variables
Component Loadings
Component
1
2
3
4
5
Uniqueness
SMM (kg)
0.981
0.0298
LBM (kg)
0.980a
0.0239
FFM (kg)
0.976
0.0357
Sex
-0.877a
0.2148
Height (cm)
0.839
0.2869
Body mass
(kg)
0.718
0.563
0.0283
LBM arm
(kg)
0.671
0.4775
Waist
circumference (cm)
0.643
0.584
0.1050
WHR
0.491
0.6486
Visceral FM
(cm2)
0.976
0.0476
PBF (%)
-0.547
0.884b
0.0556
FM arm (kg)
0.876
0.1905
BMI (kg/m²)
0.377
0.830
0.0777
Hip
circumference (cm)
0.412
0.714
0.2077
DBP (mmHg)
0.858c
0.2383
Heart rate
(BPM)
0.716
0.4312
SBP (mmHg)
0.539
0.580
0.3114
Medium PhA
0.809d
0.3496
Intense PhA
0.790
0.3652
Coffee
drinking
0.9089
Sweetened
drinks
0.667
0.5337
Tea
drinking
0.305
0.8029
Energy
drinks
0.662e
0.5178
Note. 'oblimin' rotation was used
Component 1: Lean body mass and sex
Component 2: Fat mass
Component 3: Heart and blood pressure
Component 4: Physical activity
Component 5: Energy drinks
Abbreviations: SMM, Skeletal muscle mass; LBM, Lean body mass; FFM, Fat free
mass; WHR, Waist to hip ratio; FM, Fat mass; PBF, Percent body fat; BMI, Body
mass index; DBP, Diastolic blood pressure; SBP, Systolic blood pressure; PhA,
Physical activity.
Energy drink consumption demonstrated variable effects on SOS (Table 4). Significant negative associations were observed in
individuals consuming energy drinks 1–2 days per week ( = -0.353, p = 0.009) and less than once a month ( = -0.198, p = 0.023), indicating poorer bone quality in these groups
compared to non-consumers. Additionally, sex was a significant predictor of SOS ( = 0.469, p < 0.001), with females showing higher SOS values than
males. However, no significant effects were observed for higher consumption frequencies.
Among body composition variables, LBM had a positive but non-significant association
with SOS ( = 0.632, p = 0.114), while PBF and mPhA also showed non-significant
effects. The regression model explained only 4.7% of the variance in SOS (adjusted R² =
0.035), suggesting that other unmeasured factors likely contribute to bone quality. The
T values across predictors indicated variability in their relative contributions, and
the Durbin–Watson statistic of 1.700 suggests that residuals exhibited no
autocorrelation issues, supporting the validity of the regression model.
Table 4 Association of SOS with sex, blood pressure,
body composition, physical activity and energy drink consumption frequency of
young Slovaks
Dependent variables
Predictors
Unstandardised B
Standardised
p
R2
Adjusted R2
SOS
(m/s)
Sex
(Female—Male)
54.411
16.193
<0.001*
0.047
0.035
DBP
(mmHg)
-0.463
0.478
0.333
PBF
(%)
0.238
0.548
0.664
LBM
(kg)
0.999
0.632
0.114
mPhA
(No—Yes)
-4.390
8.225
0.594
Energy
drink consumption frequency: Daily—None
-53.135
30.979
0.087
Energy
drink consumption frequency: 5–6 days/week—None
-7.530
38.438
0.845
Energy
drink consumption frequency: 3–4 days/week—None
6.749
25.495
0.791
Energy
drink consumption frequency: 1–2 days/week—None
-40.949
15.594
0.009*
Energy
drink consumption frequency: 1–3 days/month—None
-11.367
13.436
0.398
Energy
drink consumption frequency: <once a month—None
-23.019
10.084
0.023*
* Marks statistical significance p < 0.05. Abbreviations: B, beta coefficient;
p, value of statistical significance (linear regression analysis, forward
method); R2, coefficient of determination; SOS, Speed of sound; LBM, Lean body
mass; PBF, Percent body fat; DBP, Diastolic blood pressure; SBP, Systolic blood
pressure; mPhA, Physical activity of medium intensity.
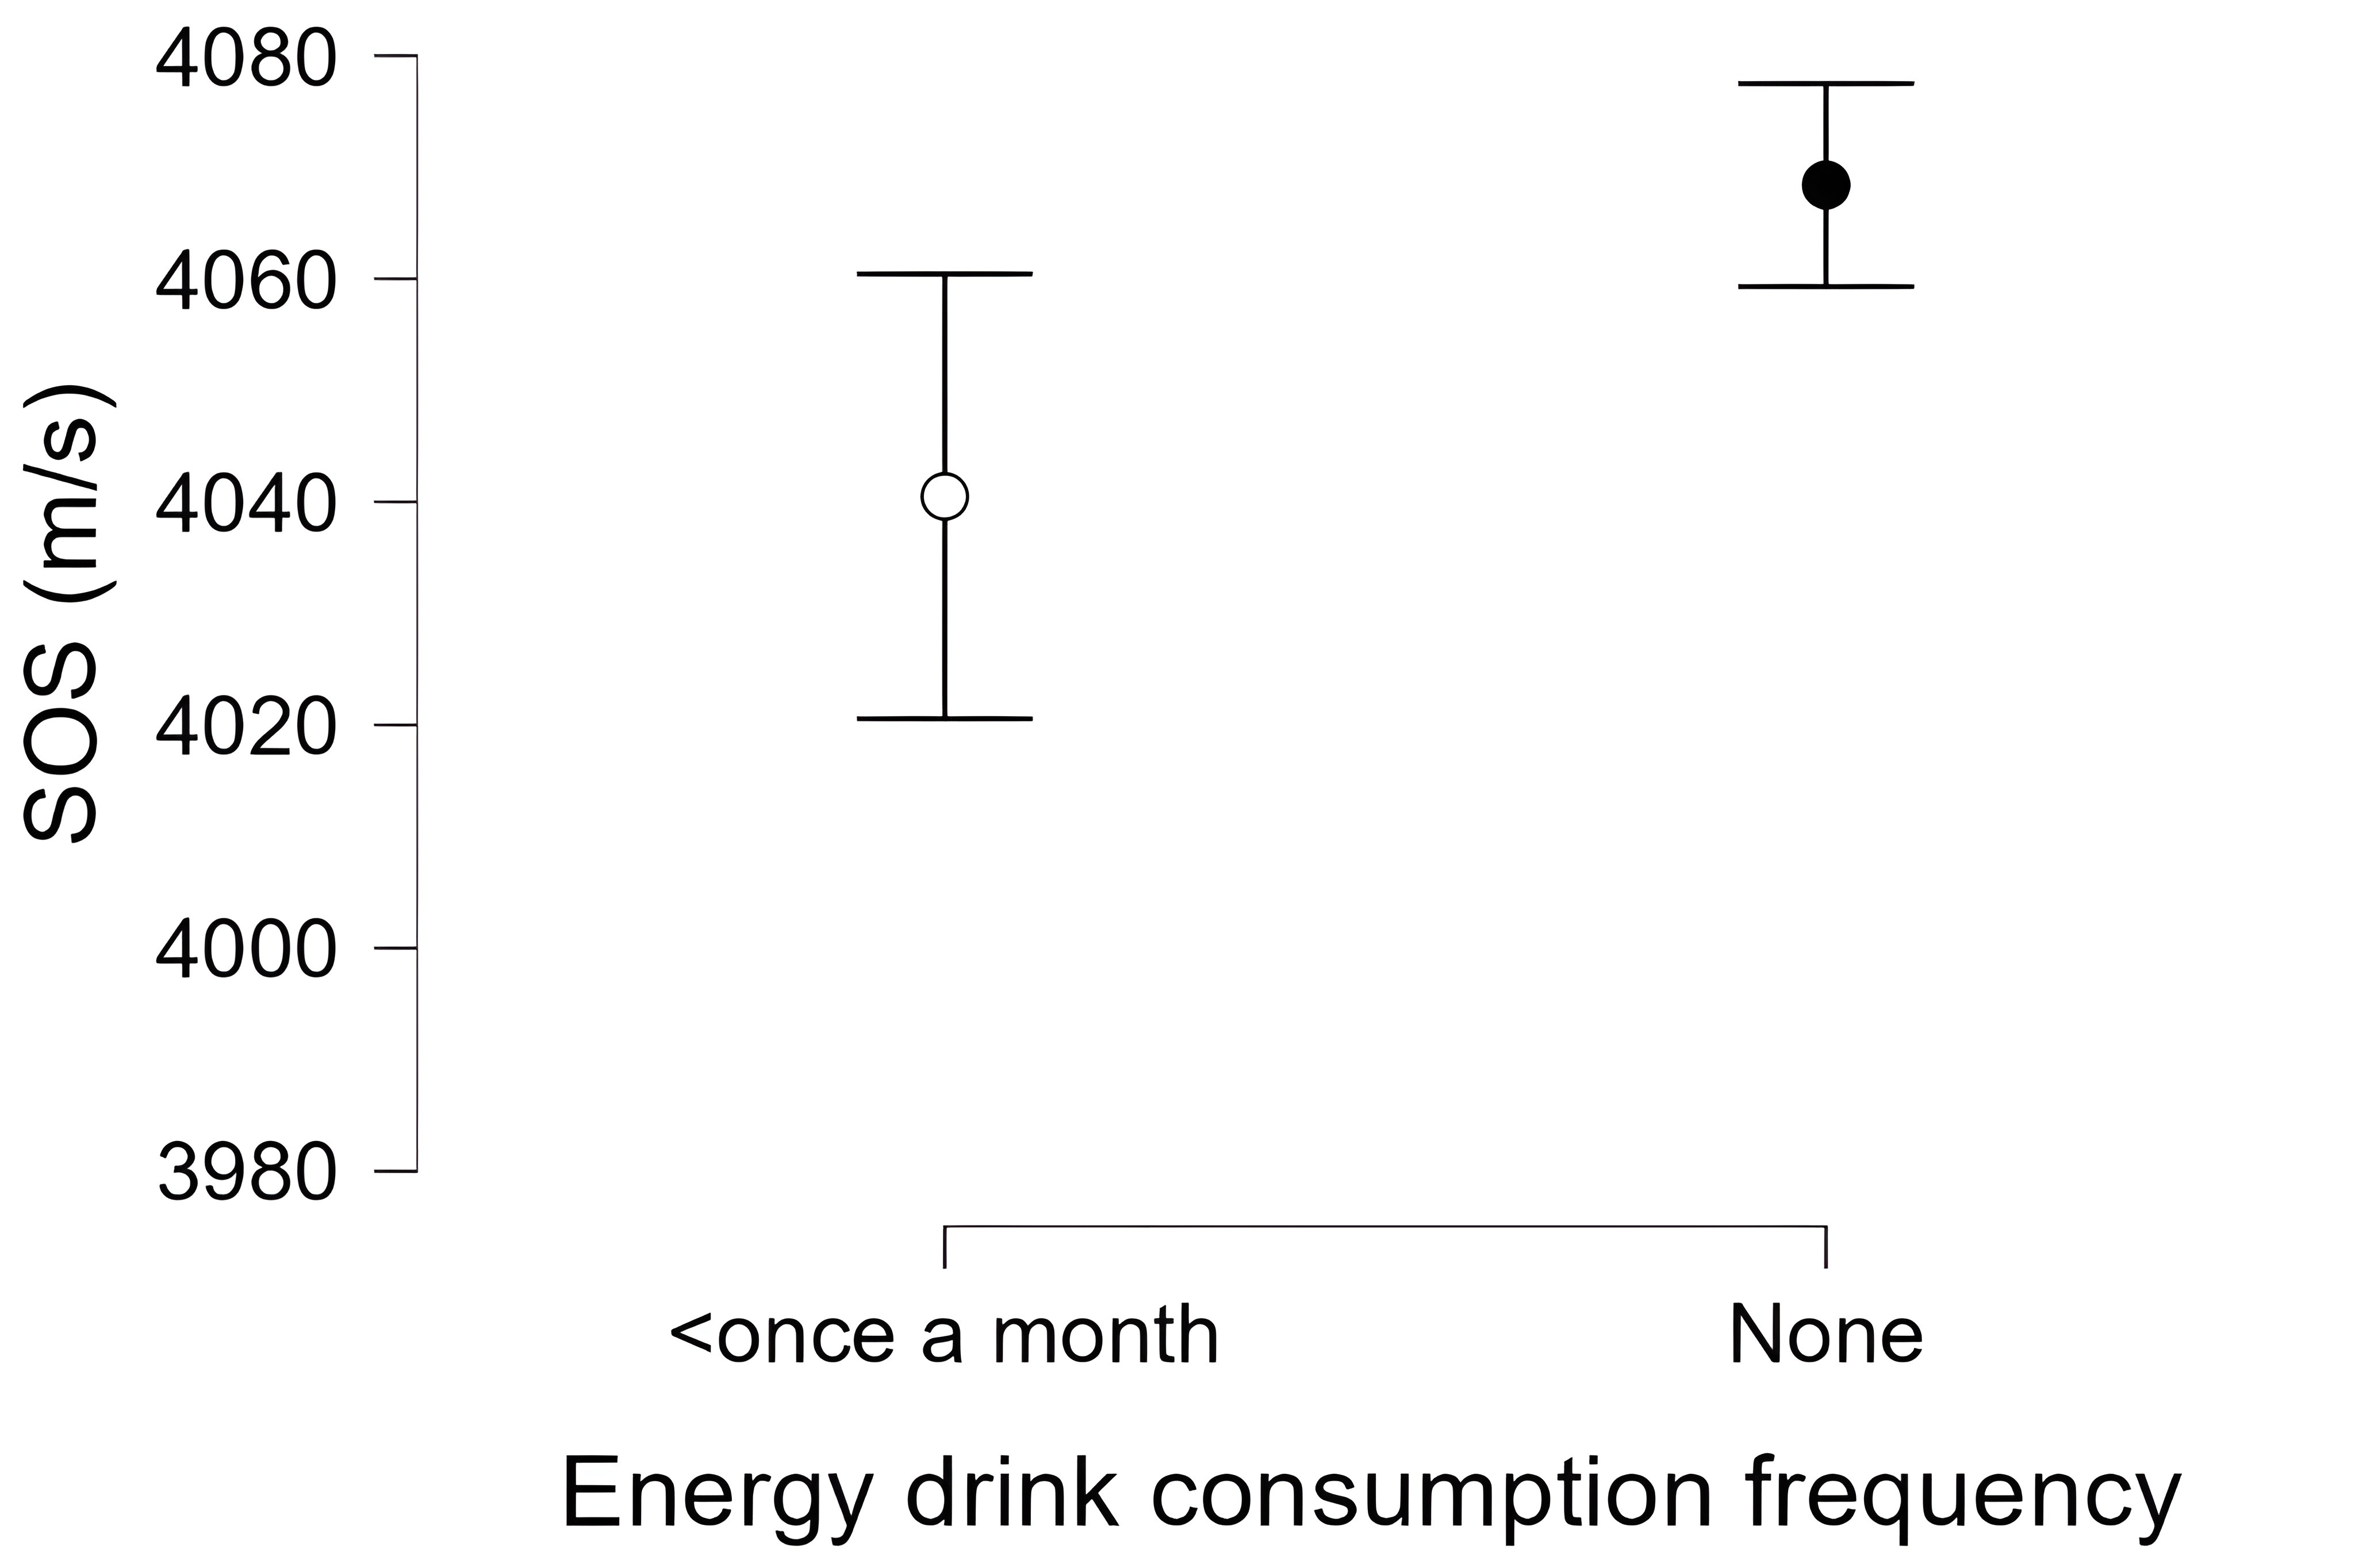
Consuming energy drinks 1–2 days per week (p = 0.009, B = -40.949) and less than
once a month (p = 0.023, B = -23.019) was associated with significantly lower SOS values
than non-EDC. Specifically, individuals who consume energy drinks 1–2 days per week
exhibit a lower SOS of approximately 40.949m/s compared to non-EDC, while those who
consume such beverages less than once a month demonstrate a lower SOS of approximately
23.019m/s (Figure 1 and 2).
Figure 1 Comparison of energy drink
consumption frequency impact, 1-2 days/week versus non-consumers on SOS,
Abbreviations: CI, confidence interval; SOS, speed of sound (Created using
JASP version 0.19.3)
Figure 2 Comparison of energy drink
consumption frequency impact, less than once a month versus non-consumers on
SOS, Abbreviations: CI, confidence interval; SOS, speed of sound (Created
using JASP version 0.19.3)
These findings suggest that even moderate or infrequent consumption of energy
drinks may be negatively associated with bone tissue. Conversely, other categories of
energy drink consumption, as well as PBF, LBM, and medium-intensity physical activity
(mPhA), did not show statistically significant effects on bone quality in our study
sample. Therefore, while specific categories of energy drink consumption were
significant predictors, the overall impact of energy drinking, physical activity, DBP
and BC on bone health was relatively modest, as indicated by the low R² (0.047) and
adjusted R² (0.035) values. After dividing EDC consumers into two groups, the first one
encompassing regular consumers (n = 42, SOS 4045.19 ± 128.83m/s) thus those who declared
to drink daily, 5–6 days/week and 3–4 days/week and a second group of medium to
low-frequency consumers (n = 318, SOS 4042.00±124.98) which included those who drank 1–2
days/week, 1–3 days/month and less than once a month, no significant differences in SOS
values were found (p = 0.747).
Since most energy drinks contain caffeine, coffee
consumption was analyzed; however, no statistically significant differences in SOS (p =
0.477) were found between coffee consumers (n = 694, SOS 4055.36 ± 119.31m/s) and
non-consumers (n = 217, SOS 4061.79 ± 105.02m/s); similar results to energy drink
consumption were also observed when coffee drinking was studied by dividing the coffee
drinkers into regular consumers (n = 478, SOS 4059.50 ± 118.70m/s) and medium to
low-frequency consumers (n = 216, SOS 4046.50 ± 120.50m/s) p = 0.746.
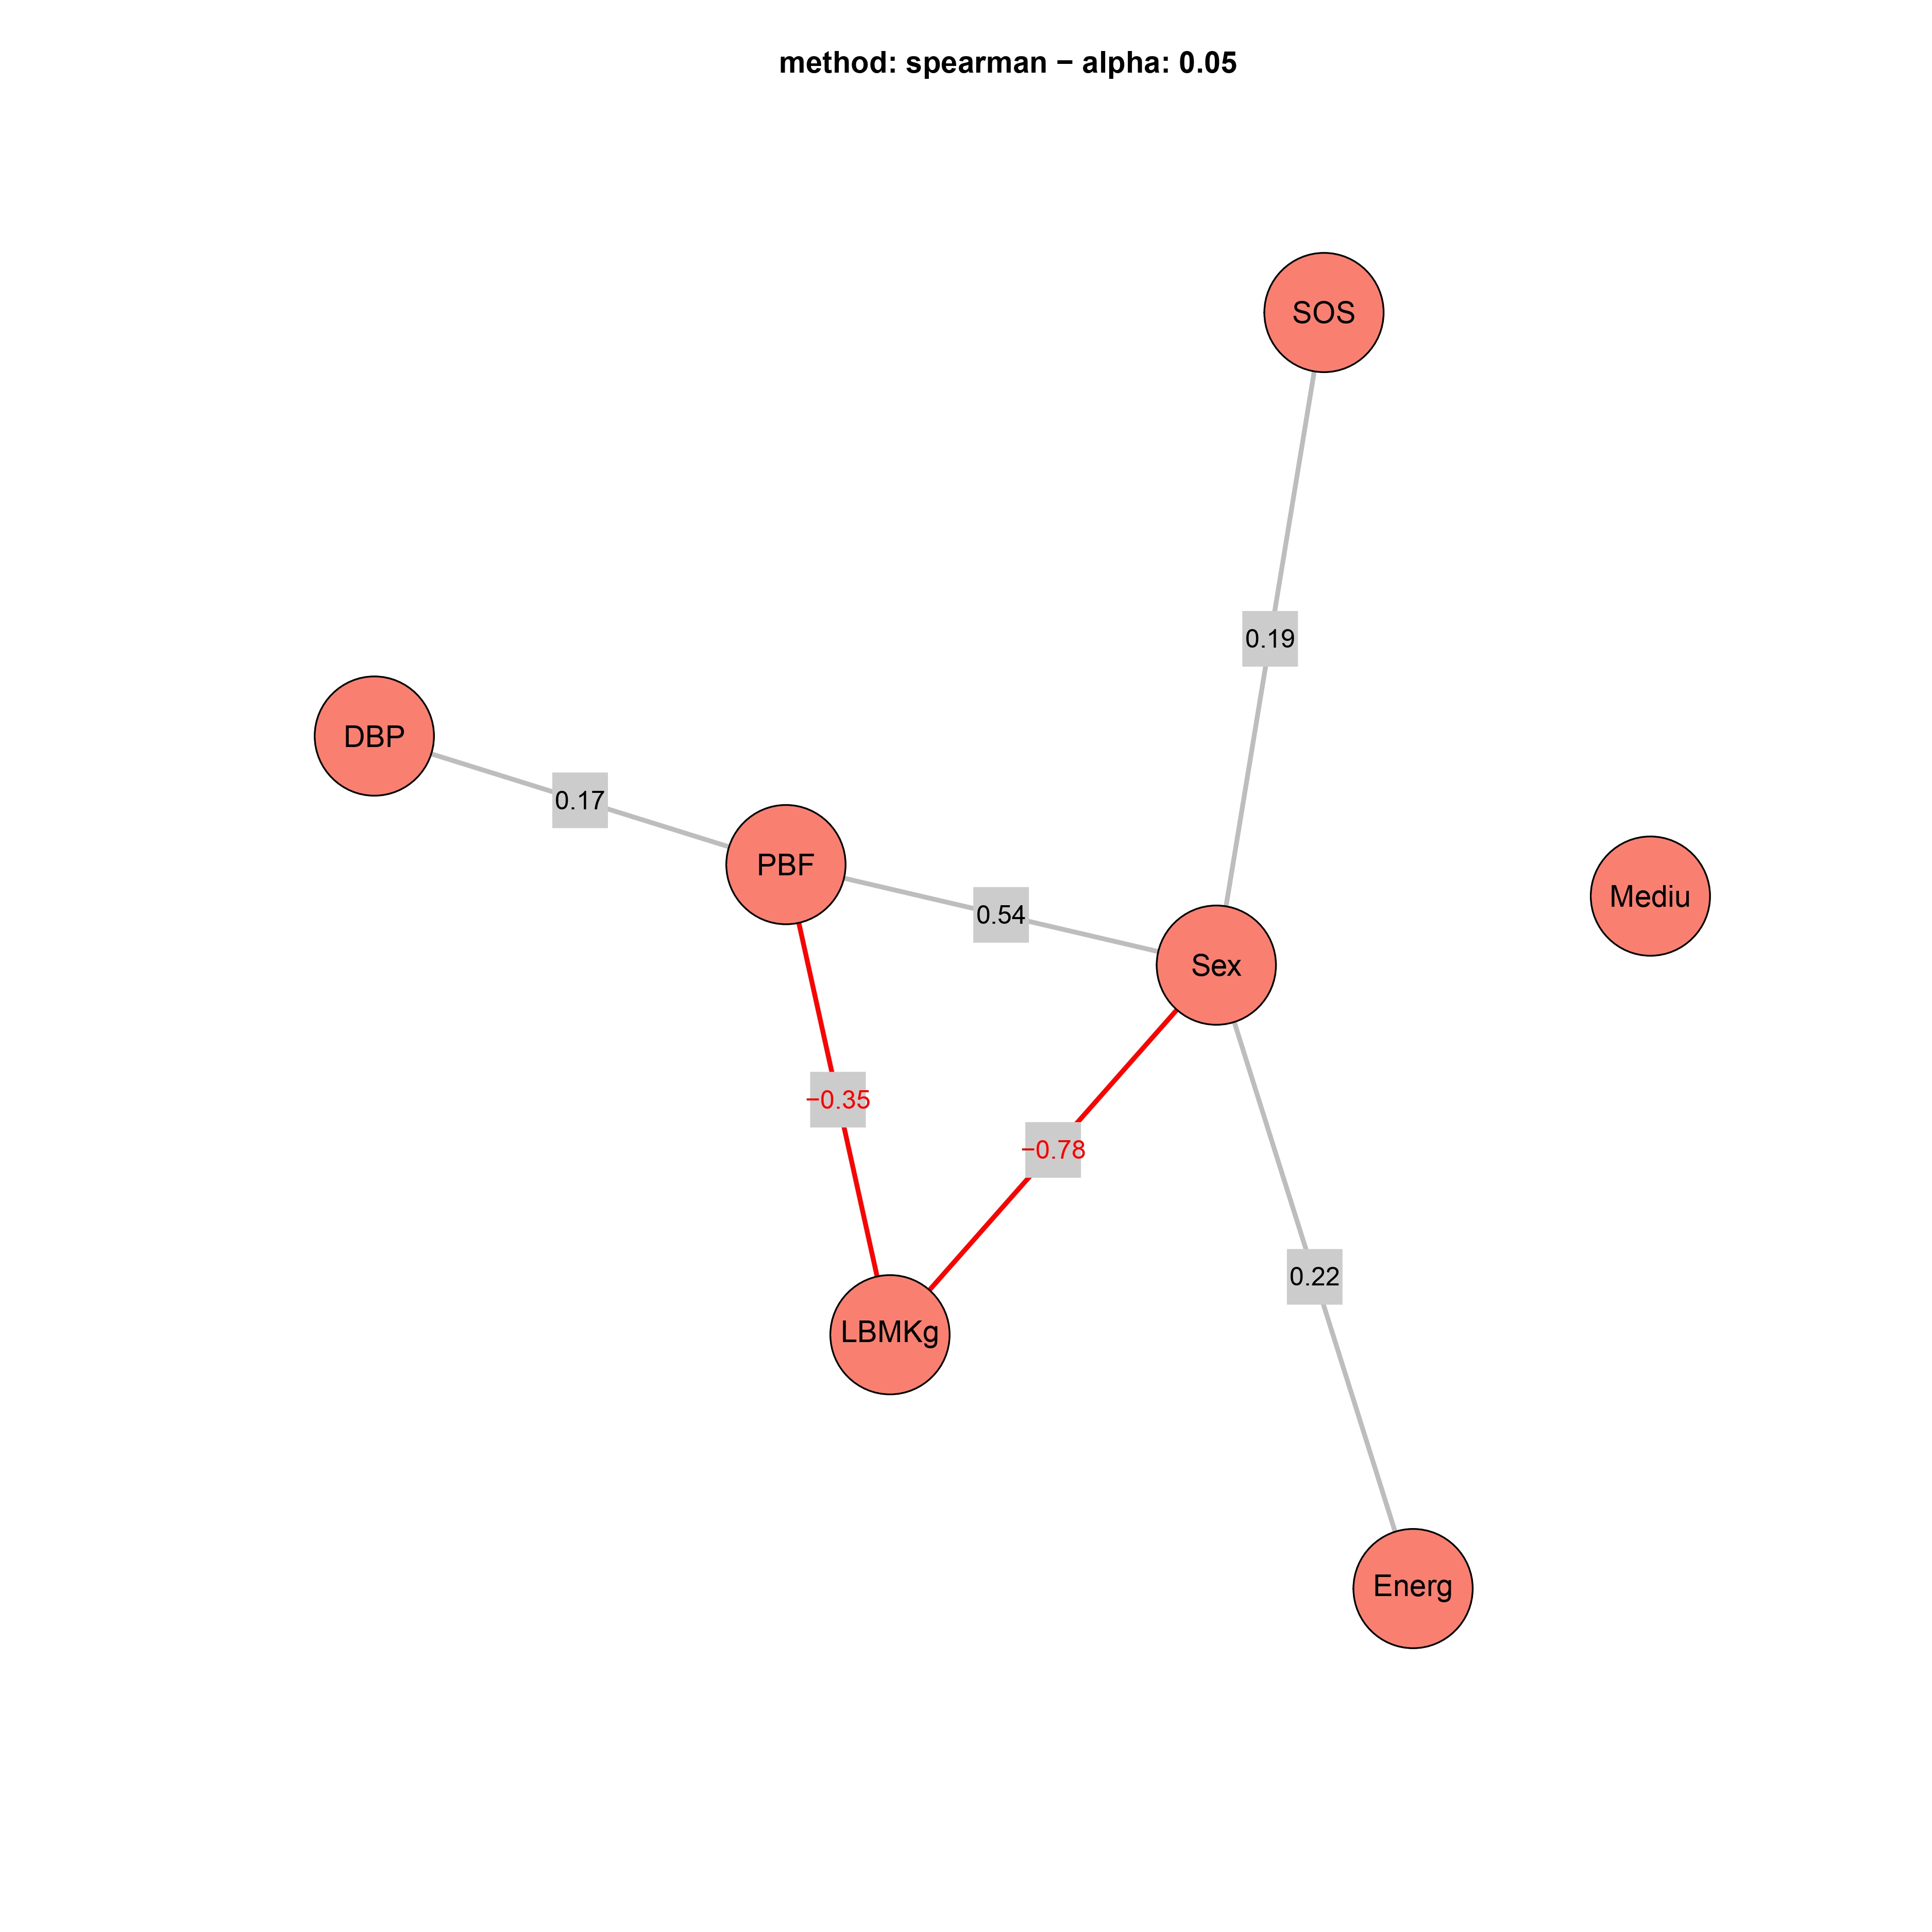
To visualize
the relationships between the variables more effectively, a St. Nicholas House analysis
was conducted (Figure 3). The results revealed that sex was a central node, exhibiting
significant correlations with LBM (r = -0.78) and PBF (r = -0.35). Energy drink
consumption did not demonstrate a direct, significant correlation with SOS, not being
directly connected but connected indirectly through sex, suggesting sex-related
differences in energy drink use and SOS. Additionally, mPhA failed to correlate
significantly with any of the variables under study.
Figure 3 St. Nicholas House graph of
variables influencing bone density concerning energy drink consumption of
young Slovaks. Abbreviations: DBP, Diastolic blood pressure; PBF, Percent
body fat; LBMKg, Lean body mass; Energ, Energy drink consumption frequency;
Mediu, Medium intensity physical activity; SOS, speed of sound (created
using R (4.4.1 - Package snha (Groth
2023)).
A chi-square test was used to investigate whether the previously observed results
could be explained by the hypothesis that regular EDC (those who drink daily, 5–6
days/week and 3–4 days/week) are more physically active, suggesting that these
individuals might use energy drinks to boost performance and sustain energy during
exercise, which could subsequently have a beneficial effect on bone density (Table 5). The results obtained indicate no statistically
significant association between the frequency of energy drink consumption and engagement
in mPhA (p = 0.507).
Table 5 Observed percentages of individuals who
either engage in medium intense physical activity or do not across different
levels of energy drink consumption frequency
Physical activity (medium intensity)
Energy drink consumption frequency
Yes
n
No
n
p
Chi-squared test
Daily
0.3%
3
1.2%
11
0.507
5.292
5–6
days/week
0.2%
2
0.8%
7
3–4
days/week
1.1%
10
1.2%
11
1–2
days/week
2.5%
23
4.3%
39
1–3
days/month
2.9%
26
6.4%
58
<once a
month
5.9%
54
13.0%
118
None
17.8%
162
42.5%
387
p statistical significance; n number of individuals, chi-squared test
Although the results were not statistically significant, it was observed that most
individuals who performed mPhA did not consume energy drinks at all. Similar results
were observed in individuals who refrained from engaging in mPhA, with the majority
reporting no consumption of energy drinks at all. Among the inactive participants,
compared to those physically active, a greater proportion reported daily consumption
(Figure 4).
Figure 4 Bar plot illustration of the
relationship between the energy drink consumption frequencyand engagement in
medium-intensity physical activity of young Slovaks (created using jamovi
version 2.3.21).
The same hypothesis, thus whether regular EDC (those who drink daily, 5–6 days/week
and 3–4 days/week) are more physically active, was also tested using a chi-square test
on those who performed intense physical activity (Table 6). The results show no statistically significant association between the
frequency of energy drink consumption and engagement in high-intensity physical
activity, similar to mPhA (p = 0.507).
Table 6 Observed percentages of individuals who
either engage in high-intensity physical activity or do not across different
levels of energy drink consumption frequency
Physical activity (high-intensity)
Energy drink consumption frequency
Yes
n
No
n
p
Chi-squared test
Daily
0.2%
2
1.3%
12
0.420
6.027
5–6
days/week
0.1%
1
0.9%
8
3–4
days/week
0.3%
3
2.0%
18
1–2
days/week
1.3%
12
5.5%
50
1–3
days/month
0.9%
8
8.3%
76
<once a
month
1.9%
17
17.0%
155
None
5.9%
54
54.3%
495
p statistical significance; n number of individuals, chi-squared test
Discussion
Energy drinks association
with bone health
This research offers important insights into how energy drink
intake might affect bone quality, utilizing SOS as a non-invasive indicator of skeletal
health. A notable strength of this investigation is its concentration on young
university students, a group often overlooked in studies concerning bone health.
Furthermore, the research thoroughly examines the frequency of energy drink consumption
and its subtle relationships with SOS, even at lower intake levels. The findings of this
study confirm the original hypothesis, albeit the SNHA showed a non-direct association
between energy drinks and SOS. Notably, those who consumed energy drinks 1–2 days per
week and less than once a month showed a significant negative association with bone
tissue quality, specifically those with a lower SOS, indicating potentially adverse
effects on bone health. This finding is particularly interesting since it illustrates
that even lower consumption frequencies are linked to a decreased SOS. This suggests
that the ingredients contained in energy drinks might have more subtle than expected yet
significant effects on bone metabolism, potentially influencing calcium absorption or
altering hormonal balances crucial for bone health. Even at low doses, ranging from 1–4
days a month with the majority not exceeding one drink per day, a study by Malinauskas
et al. (2007) observed side effects such as headaches
and heart palpitations among 496 college students in the United States, highlighting the
increasing concerns regarding potential health risks. Comparable findings were also
reported by Puupponen et al. (2023); the study
encompassed a nationally representative sample of 2429 adolescents (1260 13-year-olds
and 1169 15-year-olds) from 77 schools in Finland. The investigation revealed that
frequent energy drink consumers exhibited a significantly higher likelihood of reporting
several concerning behaviours compared to non-consumers, including elevated rates of
smoking, snus use, cannabis use, alcohol consumption, problematic social media use,
insufficient sleep, breakfast omission, inebriation, and inadequate dental hygiene. One
of the primary components of these drinks is caffeine, which, as noted by Berman et al.
(2022), may contribute to bone loss through various
mechanisms, including non-specific inhibition of adenosine receptors involved in bone
metabolism. Specifically, caffeine’s competitive inhibition of adenosine A2 receptors
could impede bone formation and promote bone resorption, while its effects on adenosine
A1 receptors may have opposing effects. Additionally, caffeine may affect bone health by
disrupting calcium metabolism and altering vitamin D responses (Berman et al. 2022). Similarly, Mubarak et al. (2023) found a significant association between cola consumption and
the occurrence of low BMD, which may be related to the caffeine content in these drinks,
although the sample of this study comprised only 85 women aged 40–70 years, thus older
than the sample in the present study, indicating that age-related differences in bone
metabolism could influence the observed results. Conversely, in our study, daily
consumption and consumption at other frequencies did not show significant associations
with SOS, which may be attributed to the small sample sizes of these categories or other
unaccounted factors. In addition, in our sample, in contrast with the literature, no
significant association was found between coffee consumption and SOS.
The absence
of significant associations between BC (PBF and LBM) and mPhA suggests that other
unmeasured variables, such as dietary patterns, genetic predispositions, or other
lifestyle behaviours, may contribute to bone health in our study sample. Specifically,
individuals who fail to engage in medium-intensity and high-intensity physical activity
show contradicting energy drink consumption patterns. Although the majority of these
individuals avoid energy drinks entirely, they show a higher proportion of daily
consumers compared to those who are physically active; therefore, it could be
hypothesized that a dependence on energy drinks is present among individuals who are
less active for various purposes, such as providing energy or other advantages (Byerley 2016). Similarly, Poulos and Pasch (2015) discovered that the consumption of energy
drinks was connected to an increase in soda and frozen meal consumption, which may
suggest an overall less healthy lifestyle associated with lower physical activity
levels. On the other hand, those who practice physical activity, compared to those who
do not practice it, tend to consume energy drinks less frequently and rely less on such
beverages to sustain their activity levels. Larson et al. (2014) found that sports and energy drink consumption was associated with higher
levels of moderate to vigorous physical activity and organized sports participation for
both sexes, suggesting that adolescents who engage in physical activity may consume
energy drinks to enhance their performance or restore energy; this trend was not
observed in our study, potentially due to differences in population characteristics,
activity levels, cultural differences, or variations in energy drink consumption, as it
analyzed 2793 American adolescents aged 14.4 ± 2 years, while our participants were
university students. Numerous other studies also observed ambiguous results, including
research involving 439 college students who regularly consumed energy drinks. These
participants either engaged in physical activity regularly or adopted unhealthy
lifestyle habits such as alcohol consumption and smoking (Attila and Çakir 2011; Protano et al.
2023).
These results demonstrate the multifaced implications of consuming
energy drinks on bone tissue, emphasizing the importance of further studies to
investigate the complex relationships between lifestyle factors, nutrition, and bone
mineral density. Moreover, the scarcity of comparable studies in the existing literature
and conflicting results regarding caffeinated beverages highlight the need for more
research on this subject. Furthermore, the differences between our findings and existing
literature may also arise from methodological variations, such as the use of different
techniques to assess bone quality. Moreover, our data on physical activity and energy
drink consumption, similar to Larson et al. (2014),
rely on self-reporting, which could introduce potential biases. These factors contribute
to the observed discrepancies in results.
Study limitations
The primary limitation of this study
was its cross-sectional design, which precluded any causal inferences. This research
also lacked detailed information regarding the duration of energy drink consumption, the
quantity consumed, and the specific type, rendering the ingredients and their quantities
unknown. Moreover, the sample size, particularly among male participants, was limited.
It is also important to acknowledge that the sample in this study consists mainly of
university students, which may introduce a form of sampling bias. This group is
relatively homogenous in terms of age and educational background compared to the broader
population. As a result, the findings of this study may not be fully generalizable to
the entire Slovak population. Additionally, it is important to acknowledge that due to
the disproportionate sex distribution within the sample, findings related to sex as a
predictor should be considered with caution. A further limitation of this research is
that it lacks data on participants’ nutrition patterns and their calcium and vitamin D
intake, which are essential for skeletal health. As a result, we cannot conclusively
establish that the observed correlations between energy drink consumption and reduced
SOS measurements are due to factors like decreased calcium absorption. As such, the
findings should be interpreted with caution and seen as indicating a possible connection
between energy drinks and bone quality, rather than definitive evidence of causation.
Subsequent studies should include comprehensive evaluations of dietary habits,
encompassing calcium and vitamin D supplements, to better understand how energy drinks
may affect bone health. Furthermore, it is essential to perform a long-term study to
obtain a more thorough insight into these interactions across time since evaluating bone
mineral density at just one point in time fails to capture ongoing changes and the
effects of these drinks on bone tissue.
Conclusion
In our study, no significant associations were observed between
physical activity, BC, and SOS. While energy drinks were not found to directly affect
bone tissue, certain consumption patterns showed significant correlations with decreased
bone density. Specifically, consuming these beverages 1–2 days per week or less than
once a month was associated with reduced bone mass. This finding suggests that even
occasional intake may have detrimental effects on skeletal health. Given the increasing
popularity of energy drinks among younger populations, it is crucial to address the
potential risks linked to their consumption. Additional studies are necessary to
thoroughly investigate this relationship and its implications.
Authors contribution:
Simona Sulis
contributed to writing the manuscript, conceptualizing it, collecting data, and
performing the statistical analysis. Lenka Vorobeľová and Darina Falbová designed the
study, participated in data collection, reviewed, and edited the manuscript. Alexandra
Hozáková participated in the data collection and writing of the manuscript. All authors
have read and agreed to the published version of the manuscript.
Acknowledgements
We want to thank the
Department of Anthropology of the Faculty of Natural Sciences of Comenius University in
Bratislava and the participants whose involvement in this study allowed its making. We
would like to extend our thanks t PD Dr. Christiane Scheffler, Prof. Dr. Michael
Hermanussen, and Dr. Detlef Groth for their guidance in the analysis and
conceptualization process of the manuscript during the 7th Summer School “Human Growth
and Development – Data Analysis and Statistics” in Gülpe, Germany, in 2024, funded by
the KoUP of the University of Potsdam. The Ministry of Education, Science, Research and
Sport of the Slovak Republic funded the study, Grant/Award Number: KEGA
046UK-4/2023.
References
AL-Hadrawy, S. M. J./Jawad, S. M. A. (2022). Harmful effects of chronic
consumption of soft drinks on the bone metabolism of laboratory female rats.
Journal of Natural Science, Biology and Medicine 13 (1). Available online at
https://jnsbm.org/menuscript/index.php/submissions/article/view/135
(accessed 9/1/2024).
Berman, N. K./Honig, S./Cronstein,
B. N./Pillinger, M. H. (2022). The effects of caffeine on bone mineral
density and fracture risk. Osteoporosis International 33 (6), 1235–1241. https://doi.org/10.1007/s00198-021-05972-w.
Birlik, M./Kazancioglu, H.
O./Aydin, M. Ş./Aksakalli, S./Ezirganli, S. (2017). Effect of Energy Drink
on Bone Formation in the Expanded Inter-Premaxillary Suture. Journal of
Craniofacial Surgery 28 (1), 285–289. https://doi.org/10.1097/SCS.0000000000003244.
Conlisk, A. J./Galuska, D. A.
(2000). Is Caffeine Associated with Bone Mineral Density in Young Adult
Women? Preventive Medicine 31 (5), 562–568. https://doi.org/10.1006/pmed.2000.0742.
Correa-Rodríguez, M./Rueda-Medina,
B./González-Jiménez, E./Correa-Bautista, J. E./Ramírez-Vélez,
R./Schmidt-RioValle, J. (2018). Dietary inflammatory index, bone health and
body composition in a population of young adults: a cross-sectional study.
International Journal of Food Sciences and Nutrition 69 (8), 1013–1019. https://doi.org/10.1080/09637486.2018.1446915.
Dane, C./Dane, B./Cetin,
A./Erginbas, M. (2008). The role of quantitative ultrasound in predicting
osteoporosis defined by dual-energy X-ray absorptiometry in pre- and
postmenopausal women. Climacteric 11 (4), 296–303. https://doi.org/10.1080/13697130802178471.
Groth, D. (2023). GitHub -
mittelmark/snha: St. Nicolas House Algorithm implementation in R -
predicting correlation networks using association chains. Available online
at https://github.com/mittelmark/snha (accessed
1/22/2025).
Groth, D./Scheffler, C./Hermanussen, M. (2019). Body height in stunted
Indonesian children depends directly on parental education and not via a
nutrition mediated pathway – Evidence from tracing association chains by St.
Nicolas House Analysis. Journal of Biological and Clinical Anthropology 76
(5), 445–451. https://doi.org/10.1127/anthranz/2019/1027.
Gutiérrez-Hellín,
J./Varillas-Delgado, D. (2021). Energy Drinks and Sports Performance,
Cardiovascular Risk, and Genetic Associations; Future Prospects. Nutrients
13 (3), 715. https://doi.org/10.3390/nu13030715.
Higgins, J. P./Babu, K./Deuster, P.
A./Shearer, J. (2018). Energy Drinks: A Contemporary Issues Paper. Current
Sports Medicine Reports 17 (2), 65–72. https://doi.org/10.1249/JSR.0000000000000454.
Higgins, J. P./Tuttle, T.
D./Higgins, C. L. (2010). Energy Beverages: Content and Safety. Mayo Clinic
Proceedings 85 (11), 1033–1041. https://doi.org/10.4065/mcp.2010.0381.
Hurt, R. T./Ebbert, J. O./Croghan,
I./Nanda, S./Schroeder, D. R./Teigen, L. M./Velapati, S. R./Mundi, M. S.
(2021). The Comparison of Segmental Multifrequency Bioelectrical Impedance
Analysis and Dual‐Energy X‐ray Absorptiometry for Estimating Fat Free Mass
and Percentage Body Fat in an Ambulatory Population. Journal of Parenteral
and Enteral Nutrition 45 (6), 1231–1238. https://doi.org/10.1002/jpen.1994.
Kaufman, J. J./Einhorn, T. A.
(1993). Perspectives: Ultrasound assessment of bone. Journal of Bone and
Mineral Research 8 (5), 517–525. https://doi.org/10.1002/jbmr.5650080502.
Kaur, A./Yousuf,
H./Ramgobin-Marshall, D./Jain, R./Jain, R. (2022). Energy drink consumption:
a rising public health issue. Reviews in Cardiovascular Medicine 23 (3), 83.
https://doi.org/10.31083/j.rcm2303083.
Larson, N./DeWolfe, J./Story,
M./Neumark-Sztainer, D. (2014). Adolescent Consumption of Sports and Energy
Drinks: Linkages to Higher Physical Activity, Unhealthy Beverage Patterns,
Cigarette Smoking, and Screen Media Use. Journal of Nutrition Education and
Behavior 46 (3), 181–187. https://doi.org/10.1016/j.jneb.2014.02.008.
Liu, S. H./Chen, C./Yang, R.
S./Yen, Y. P./Yang, Y. T./Tsai, C. (2011). Caffeine enhances osteoclast
differentiation from bone marrow hematopoietic cells and reduces bone
mineral density in growing rats. Journal of Orthopaedic Research 29 (6),
954–960. https://doi.org/10.1002/jor.21326.
Lohman, Timothy G./Roche, Alex
F./Martorell, Reynaldo (Eds.) (1988). Anthropometric standardization
reference manual. Champaign, IL, Human Kinetics
Books.
Malinauskas, B. M./Aeby, V. G./Overton, R. F./Carpenter-Aeby,
T./Barber-Heidal, K. (2007). A survey of energy drink consumption patterns
among college students. Nutritional Journal 6, 35. https://doi.org/10.1186/1475-2891-6-35.
Mazurek-Kusiak, A. K./Kobyłka,
A./Korcz, N./Sosnowska, M. (2021). Analysis of Eating Habits and Body
Composition of Young Adult Poles. Nutrients 13 (11). https://doi.org/10.3390/nu13114083.
McGartland, C./Robson, P./Murray,
L./Cran, G./Savage, M./Watkins, D./Rooney, M./Boreham, C. (2003). Carbonated
Soft Drink Consumption and Bone Mineral Density in Adolescence: The Northern
Ireland Young Hearts Project. Journal of Bone and Mineral Research 18 (9),
1563–1569. https://doi.org/10.1359/jbmr.2003.18.9.1563.
McMichan, L./Dick, M./Skelton, D.
A./Chastin, S./Owen, N./Dunstan, D. W./Fraser, W. D./Tang, J./Greig, C.
A./Agyapong-Badu, S./Mavroeidi, A. (2021). Sedentary behaviour and bone
health in older adults: a systematic review. Osteoporos Int 32 (8),
1487–1497. https://doi.org/10.1007/s00198-021-05918-2.
Mubarak, B./Ahmed, M./Hussein,
N./Ibrahim, M. E. E.-D. (2023). Vitamin D, calcium and caffeine intake
relationship to bone mineral density. Arab Gulf Journal of Scientific
Research. https://doi.org/10.1108/AGJSR-02-2023-0051.
National Institutes of Health
(1996). Bioelectrical impedance analysis in body composition measurement:
National Institutes of Health Technology Assessment Conference Statement.
The American Journal of Clinical Nutrition 64 (3 Suppl), 524S-532S. https://doi.org/10.1093/ajcn/64.3.524S.
Nowak, D./Jasionowski, A. (2015).
Analysis of the Consumption of Caffeinated Energy Drinks among Polish
Adolescents. International Journal of Environmental Research and Public
Health 12 (7), 7910–7921. https://doi.org/10.3390/ijerph120707910.
Nuss, T./Morley, B./Scully,
M./Wakefield, M. (2021). Energy drink consumption among Australian
adolescents associated with a cluster of unhealthy dietary behaviours and
short sleep duration. Nutritional Journal 20 (1), 64. https://doi.org/10.1186/s12937-021-00719-z.
Pavlovic, N./Miskulin, I./Jokic,
S./Kovacevic, J./Miskulin, M. (2023). Consumption of Energy Drinks among
University Students in Eastern Croatia. Applied Sciences 13 (2), 1124. https://doi.org/10.3390/app13021124.
Poulos, N. S./Pasch, K. E. (2015).
Energy drink consumption is associated with unhealthy dietary behaviours
among college youth. Perspectives in Public Health 135 (6), 316–321. https://doi.org/10.1177/1757913914565388.
Protano, C./Valeriani, F./Giorgi,
A. de/Marotta, D./Ubaldi, F./Napoli, C./Liguori, G./Romano Spica, V./Vitali,
M./Gallè, F. (2023). Consumption patterns of energy drinks in university
students: A systematic review and meta-analysis. Nutrition 107, 111904. https://doi.org/10.1016/j.nut.2022.111904.
Puupponen, M./Tynjälä, J./Välimaa,
R./Paakkari, L. (2023). Associations between adolescents’ energy drink
consumption frequency and several negative health indicators. BMC Public
Health 23 (1), 258. https://doi.org/10.1186/s12889-023-15055-6.
Somers, K. R./Svatikova, A. (2020).
Cardiovascular and Autonomic Responses to Energy Drinks—Clinical
Implications. Journal of Clinical Medicine 9 (2), 431. https://doi.org/10.3390/jcm9020431.
Souchek, J./Stamler, J./Dyer, A.
R./Paul, O./Lepper, M. H. (1979). The value of two or three versus a single
reading of blood pressure at a first visit. Journal of chronic diseases 32
(3), 197–210. https://doi.org/10.1016/0021-9681(79)90065-1.
Tambalis, K. D. (2022). The effect
of electrolytes and energy drinks consumption on athletic performance – a
narrative review. European Journal of Fitness, Nutrition and Sport Medicine
Studies 3 (1). https://doi.org/10.46827/ejfnsm.v3i1.127.
Wang, J.-P./Wei, C.-C./Peng,
Y.-D./Wang, H.-Y./Hung, C.-H./Hong, Y.-H./Liou, Y.-F./Hou, C.-W. (2022).
Dose caffeinated energy drink is a consideration issue for endurance
performance. Frontiers in Physiology 13, 999811. https://doi.org/10.3389/fphys.2022.999811.
Watts, A. W./Rydell, S.
A./Eisenberg, M. E./Laska, M. N./Neumark-Sztainer, D. (2018). Yoga's
potential for promoting healthy eating and physical activity behaviors among
young adults: a mixed-methods study. Int J Behav Nutr Phys Act 15 (1), 42.
https://doi.org/10.1186/s12966-018-0674-4.
Weiss, M./Koren-Michowitz,
M./Segal, E./Ish-Shalom, S. (2003). Monitoring Response to Osteoporosis
Therapy With Alendronate by a Multisite Ultrasound Device. Journal of
Clinical Densitometry 6 (3), 219–224. https://doi.org/10.1385/JCD:6:3:219.
 ✉
✉