BackgroundTurkish migrants in Western Europe exhibit higher adiposity than non-migrants, yet how integration policies shape body composition beyond body mass index (BMI) remains underexplored.
Objectives: To examine how contrasting integration regimes — integration-oriented (Germany) versus multicultural (Netherlands) — shape body composition in Turkish adults, focusing on sex-specific biocultural adaptations.
Sample and MethodsCross-sectional study of 478 Turkish adults (aged 18–65 years) across Türkiye, Germany, and the Netherlands. Standardised anthropometry assessed BMI, detailed body composition, and frame index. Analyses comprised regression modelling and St. Nicolas House Analysis (SNHA).
ResultsGermany and the Netherlands independently predicted elevated arm fat area (AFA) relative to Türkiye (β=0.061–0.073, p<0.05). Country independently predicted AFA variance in females (ΔR²=0.025, p=0.017), with Germany predicting higher arm muscle area (AMA; β=0.128, p=0.031). Principal component regression identified a country-of-residence dimension, which may reflect differences in integration policy context, explaining 12.0% of variance in both outcomes (p<0.001). In males, cross-country differences were largely accounted for by age. SNHA revealed sex-specific network organization in Türkiye. In migrant subgroups, the education/income association was restructured or absent, negatively mediated through return intention in Dutch males, and partially embedded in the body composition cluster in Dutch females.
ConclusionsCountry of residence — interpreted as a partial, indirect proxy for integration policy context alongside other unmeasured factors — was independently associated with body composition in female migrants. Sex-responsive public health interventions are needed to address structural determinants of migrant well-being.
Keywords: Migrant health, Integration policy, Body composition, Biocultural adaptation, Anthropometry
Conflict of interest statement: The authors declare that they have no conflict of interest.
Citation: Özer, B. et al. (2026). Improved social integration shapes female body composition in Turkish migrants: biocultural evidence from Germany and the Netherlands. Human Biology and Public Health. https://doi.org/10.52905/hbph2026.134.
Permissions: The copyright remains with the authors. Copyright year 2026. Unless otherwise indicated, this work is licensed under a Creative Commons License Attribution 4.0 International. This does not apply to quoted content and works based on other permissions.
Where migrants live matters as much as how they live. Integration policies shape not just social outcomes but the body itself — particularly in women, whose muscle and fat distribution reflects the structural environment created by host country institutions.
Abbreviations
Anthropometric & body composition
AFAArm Fat Area
AMAArm Muscle Area
BF%Body Fat Percentage
BMIBody Mass Index
FFMFat-Free Mass
FIFrame Index
FMFat Mass
MMMuscle Mass
MUACMid-Upper Arm Circumference
TSFTriceps Skinfold Thickness
WHRWaist-to-Hip Ratio
Statistical
ANCOVAAnalysis of Covariance
ANOVAAnalysis of Variance
HSDHonestly Significant Difference
η²Eta Squared (partial effect size)
ΔR²Change in R²
PCRPrincipal Component Regression
R²Coefficient of Determination
SDStandard Deviation
SEStandard Error
TEMTechnical Error of Measurement
VIFVariance Inflation Factor
Other
PAPhysical Activity
SNHASt. Nicolas House Analysis
Contents
Introduction
Patterns of human body composition reflect the interaction between genetic potential, developmental plasticity, and environmental constraints operating throughout the life course. Somatic reserves, particularly muscle and fat compartments, are shaped by nutritional availability, physical activity, psychosocial stress, and socioeconomic conditions and serve as key indicators of ecological adaptation and biocultural well-being (Frisancho 1990; Bogin 2020). Among adults, the arm muscle area (AMA) and arm fat area (AFA) are sensitive markers of protein and energy reserves and are widely used in anthropological and epidemiological research to assess variations in nutritional status across populations (Frisancho 1981; Frisancho 1984; Heymsfield et al. 1982).
Migration represents a major ecological transition that can disrupt established behavioural, dietary, and activity patterns, while introducing new social and economic constraints. Turkish migrants in Western Europe, particularly in Germany and the Netherlands, constitute one of the largest and most established migrant populations and have consistently exhibited higher levels of overweight and obesity than both host country populations and individuals residing in Türkiye (Ujcic-Voortman et al. 2011; Baran et al. 2024). These patterns have been attributed to nutritional acculturation, adoption of energy-dense diets, reduced physical activity, and socioeconomic disadvantage arising from barriers to employment, education, healthcare access, and language proficiency (Delavari et al. 2013; Dijkshoorn et al. 2008; Koca and Lapa 2014). However, most existing studies rely primarily on body mass index (BMI), which offers limited insight into the nuanced physiological adaptations and health implications of migration on the underlying components of body composition, such as fat and muscle reserves.
Biocultural frameworks emphasise that body composition reflects dynamic interactions between ecological conditions, social stressors, and metabolic regulation. Chronic psychosocial stress and socioeconomic inequality have been shown to influence long-term patterns of adiposity and somatic maintenance, thereby reshaping energy allocation across tissues (Bogin 2020; Wells 2010). From an evolutionary perspective, constrained environments and social marginalisation may promote increased fat storage while limiting investment in lean tissue, resulting in population-specific body composition patterns (Ulijaszek 1995; Wells 2010). These biocultural dynamics are not uniform across host societies; rather, they depend on the institutional and social conditions that migrants face in each host country.
European countries differ in their institutional approaches to migrant integration, creating distinct social environments that may influence the health outcomes of migrants. The Netherlands have historically emphasised multicultural policies that allow the maintenance of ethnic identity and community structures, whereas Germany has implemented more integration-oriented frameworks that encourage participation in host country institutions (Arends-Tóth and van de Vijver 2002; Ersanilli and Koopmans 2010). These differences may shape access to employment, education, and health resources, as well as everyday behavioural patterns relevant to the risk of obesity. Yet the differential impact of these varied integration regimes on specific components of body composition — beyond BMI — remains underexplored.
This study systematically investigates how migration and contrasting socio-political contexts shape somatic composition among Turkish adults by comparing AMA, AFA, and other anthropometric indicators across populations in Türkiye, Germany, and the Netherlands. A key contribution of this work is its examination of whether Turkish migrants exhibit higher adiposity and altered soft-tissue profiles relative to non-migrant populations, with a particular focus on identifying whether these patterns are more pronounced and distinct among females. Building on these gaps, we further assessed whether differences between host country contexts — namely, Germany's integration-oriented and the Netherlands' multicultural policies — are reflected in divergent biocultural signatures of body composition, moving beyond BMI to a more granular analysis of somatic change. To complement conventional regression-based approaches, St. Nicolas House Analysis (SNHA) (Hermanussen et al. 2021) was applied to characterise the multivariate association structure among body composition, sociodemographic, and behavioural variables across all six sex-by-country subgroups, providing network-level evidence for the structural reorganisation of somatic and socioeconomic variables under differing integration regimes.
We hypothesized that Turkish migrants would display higher BMI and AFA relative to non-migrants, particularly among females, while AMA would exhibit moderate variation, with greater lean tissue development in integration-oriented policy contexts. We further hypothesized that host country integration context would independently predict body composition patterns, with integration-oriented policies associated with greater lean tissue development and multicultural policies associated with higher adiposity in female migrants.
Sample and methods
Sample
This cross-sectional study included 478 Turkish adults stratified by sex and country of residence (Türkiye, Germany, and the Netherlands). The sample comprised 278 participants from Türkiye (119 males and 159 females), 75 from Germany (30 males and 45 females), and 125 from the Netherlands (53 males and 72 females). A stratified sampling approach was employed to ensure representation across age groups (18–65 years), socioeconomic strata, and educational levels. The overall mean age was 38.8±13.5 years (Türkiye: males 33.7±12.6 [18–58], females 35.6±11.6 [18–62]; Germany: males 40.2±12.6 [18–65], females 41.2±11.9 [20–63]; the Netherlands: males 43.2±15.0 [19–65], females 49.0±12.1 [18–65]). Because body composition changes across adulthood, age was treated as a key potential confounder and was therefore incorporated into all subsequent statistical models through age-adjusted analyses (ANCOVA) and multivariable regression. Eligibility required participants to be of Turkish origin, aged 18–65 years, and resident in their country for at least five years to ensure sufficient exposure to local sociocultural conditions. Individuals with chronic diseases or treatments known to affect body composition (e.g., cancer, endocrine disorders, corticosteroid use) were excluded. All participants provided written informed consent. All procedures complied with the Declaration of Helsinki.
Sociodemographic and Behavioural Variables
Sociodemographic characteristics were collected via structured questionnaires. Educational attainment was categorized as low (is less than or equal to8 years), middle (9–12 years), or high (>12 years). Household income was classified relative to the median income of the country of residence (below standard, standard, above standard, or non-response). Behavioural variables included smoking status (yes/no), alcohol consumption (yes/no), physical activity level was assessed based on self-reported frequency and duration of sport participation who reported engaging in sport activity on more than 2 days per week, with each session lasting longer than 40 minutes, were classified as regularly active (yes/no), and meal-skipping frequency (always, sometimes, never). Among migrants, language use as primary language/mother tongue was categorized as Turkish-only, host country language-only, or bilingual, ability to speak host country’s language was recorded as yes/no, and intention to return to Türkiye was classified as yes, maybe, or no. These variables were used descriptively and included as covariates in regression models where appropriate.
Anthropometric Measurements and Indices
Anthropometric measurements were performed following the standardised protocols of the International Biological Program (Weiner and Lourie 1969; Roche et al. 1996). All measurements were taken on the right side of the body by a single trained observer to minimise inter-observer error, with participants in a standardised anatomical position wearing light clothing. Body weight was recorded to the nearest 0.1kg (Tanita SC-330, Japan) and height to the nearest 0.1cm (SECA 230). Triceps skinfold thickness (TSF) was assessed using a Harpenden calliper (precision 0.2mm), and mid-upper arm circumference (MUAC) was measured to the nearest 0.1cm using a non-elastic tape measure. Elbow breadth was measured at the humeral epicondyles with the elbow flexed at 90° using a sliding calliper. Intra-observer technical error of measurement (TEM) was maintained within established acceptable limits. Body composition parameters — body fat percentage (BF%), fat mass (FM), and fat-free mass (FFM) — were assessed using bioelectrical impedance analysis (Tanita SC-330). The frame index, which is a skeletal-based indicator reflecting developmental history and cumulative physical activity patterns across the previous life course in childhood and adolescence (Scheffler and Hermanussen 2014; Mumm et al. 2021) was evaluated. The following indices were calculated using standard equations:
•
Body mass index (BMI, kg/m²) = weight (kg)/height (m)²
•
Arm muscle area (AMA, cm²) = [MUAC−(π×TSF)]²/(4π)
•
Arm fat area (AFA, cm²) = (MUAC²/4π)−AMA
•
Frame index (FI) = (elbow breadth [mm]/height [cm])×100
Statistical Analysis
Statistical significance was set at α=0.05. Descriptive statistics (means, standard deviations, and frequencies) were calculated by sex and country of residence. Normality was assessed using the Shapiro–Wilk test and Q–Q plots; homogeneity of variance was evaluated using Levene's test. Age differences across countries were examined using one-way analysis of variance (ANOVA). Group comparisons for anthropometric and body composition variables were conducted using one-way ANOVA or Welch's ANOVA where the assumption of variance homogeneity was violated. Effect sizes were reported as partial eta squared (η²). Given the broad adult age range (18–65 years) and the well-established influence of ageing on body composition, age was treated as a key confounding variable throughout all statistical analyses. Accordingly, analyses of covariance (ANCOVA) and multivariable regression models were used to account for age-related variation. The assumption of homogeneity of regression slopes was tested using an age×country interaction term; where this assumption was violated, the results were interpreted with caution. Post hoc pairwise comparisons for continuous variables used Tukey's honestly significant difference (HSD) test. Categorical variables were analysed using chi-square tests or Fisher's exact test where expected cell frequencies were below five. Pairwise post hoc comparisons for categorical variables were conducted using Bonferroni-adjusted chi-square tests to control the familywise error rate across multiple country comparisons. Multiple linear regression models were constructed to identify predictors of AMA and AFA across the full sample. Predictor variables included BMI, body fat percentage (BF%), fat-free mass (FFM), age, sex, and country of residence (Türkiye=reference category). Multicollinearity was assessed using variance inflation factors (VIF<5 for all predictors); model assumptions were evaluated through residual diagnostics. Model fit was reported as R² and overall F statistics. To address multicollinearity among anthropometric predictors and identify latent structural dimensions, principal component regression (PCR) was applied. Principal components were derived from 10 predictor variables (age, sex, BMI, BF%, FFM, FM, FI, MUAC, and country dummies for Germany and the Netherlands). Components with eigenvalues exceeding 1.0 (Kaiser criterion) were retained, and the resulting component scores were used as predictors in regression models for AMA and AFA. Component loadings were inspected to characterise the latent dimensions underlying the predictor set. To examine the incremental contribution of integration policy context beyond individual-level covariates, hierarchical multiple regression was conducted separately for females, with AMA and AFA as outcomes. Predictors were entered in four sequential blocks: (1) age; (2) sociodemographic variables (education, income); (3) behavioural variables (physical activity, smoking, alcohol consumption); and (4) country of residence as a proxy for integration policy context (Türkiye=reference; Germany=integration-oriented; the Netherlands=multicultural). The R² change (ΔR²) and F-change statistics at each step were used to assess the incremental variance explained by each block above and beyond prior blocks.
To further explore the multivariate association structure among body composition, sociodemographic, and behavioural variables across subgroups, St. Nicolas House Analysis (SNHA) was conducted separately for each sex-by-country combination, yielding six network graphs. SNHA is a graph-theoretical method for detecting associations among interacting variables by applying chain reversion to a Pearson correlation matrix, thereby identifying statistically meaningful pairwise links while suppressing indirect or spurious associations (Hermanussen et al., 2021). Analyses were conducted for Turkish males and females residing in Türkiye (country=3), the Netherlands (country=1), and Germany (country=2). Each network included the following variables: age, height (H), weight (W), BMI, arm muscle area (AMA), arm fat area (AFA), body fat percentage (Fat%), triceps skinfold thickness (TSF), mid-upper arm circumference (MUAC), waist-to-hip ratio (WHR), frame index (FI), educational attainment (edu), household income (income), physical activity (PA), alcohol consumption (alcoh), smoking status (smoke), and meal-skipping frequency (meals). For migrant subgroups (Germany and the Netherlands), return intention (retur) was additionally included as a variable specific to the migration context. Statistical significance was set at α=0.05. The resulting correlation networks were visualised as undirected graphs in which nodes represent variables and edges represent statistically significant Pearson correlations; red edges indicate negative associations and grey edges indicate positive associations, with edge labels denoting correlation magnitude.
All analyses were conducted in IBM SPSS Statistics (version 30.0; IBM Corp., Armonk, NY, USA) and R (version 4.2.3; R Core Team, Vienna, Austria).
Results
This study included 478 Turkish adults from three countries (Türkiye, Germany, and the Netherlands; Table 1). Sociodemographic characteristics varied significantly across countries and sexes. Participants in Türkiye reported the highest levels of high educational attainment (males: 62.2%; females: 69.2%), whereas migrants in the Netherlands reported the lowest rates (males: 18.9%; females: 19.4%), with a substantially higher proportion in the low education category (males: 26.4%; females: 52.8%), differences that were significant for both males [χ²(4)=44.88, p<0.001] and females [χ²(4)=69.07, p<0.001]. Household income followed also a gradient: German males reported the highest rates of standard or above-standard income (80.0%), while females in the Netherlands showed the highest proportion of below-standard income (56.9%) [males: χ²(4)=18.91, p=0.001; females: χ²(4)=30.85, p<0.001]. Physical activity levels differed significantly among females, increasing from Türkiye (18.2%) to Germany (37.8%) and the Netherlands (51.4%) [χ²(2)=27.42, p<0.001], whereas no significant country difference was observed among males [χ²(2)=1.14, p=0.566]. Alcohol consumption declined markedly from Türkiye to the Netherlands in both sexes [males: χ²(2)=8.90, p=0.012; females: χ²(2)=26.01, p<0.001]. Smoking prevalence and meal-skipping frequency did not differ significantly across countries in either sex (p>0.05 for both). Post hoc pairwise comparisons confirmed country-specific differences across sociodemographic and behavioural variables (Table 1).
Table 1 Sociodemographic characteristics of Turks by sex and country of residence
Note. Values are n (%) unless otherwise stated. chi squared tests compare countries within each sex separately. Age differences are reported in Table 2 (ANOVA). Physical activity refers to regular sport participation (yes/no). Smoking and alcohol consumption were analysed using valid responses only. Meal skipping combines participants who reported either always or sometimes skipping meals. Superscript letters indicate significant pairwise differences after Bonferroni correction (p<0.05). † Primary language and host-country language proficiency were assessed only among migrant participants (Germany and the Netherlands). Therefore, no data are available for participants residing in Türkiye.a Significantly different from Türkiye (Bonferroni-adjusted p<0.05). b Significantly different from Germany (Bonferroni-adjusted p<0.05).
Significant age differences were observed across countries for both males and females (Table 2). Participants in the Netherlands were the oldest group, followed by those in Germany and Türkiye (males: F=10.50, p<0.001, η²=0.095; females: F=31.90, p<0.001, η²=0.189), confirming the importance of treating age as a major confounder in subsequent analyses. Therefore, all between-country comparisons were repeated using age-adjusted ANCOVA models. In males, unadjusted analyses revealed limited country differences in body composition (Table 2). Most anthropometric variables, including BMI, AMA, and AFA, did not differ significantly between countries. Only fat percentage (F=6.68, p=0.001) and frame index (F=5.77, p=0.003) showed significant variation, with higher values observed in migrants. In contrast, females exhibited substantial country differences in nearly all anthropometric variables (Table 2). BMI, AMA, AFA, and mid-upper arm circumference (MUAC) progressively increased from Türkiye to Germany and the Netherlands, with moderate to large effect sizes. The frame index demonstrated the strongest country effect (F=29.81, p<0.001, η²=0.180), indicating pronounced differences in skeletal robustness across populations.
Table 2 Unadjusted anthropometric characteristics (ANOVA) of Turks by sex and country of residence
Males
Females
Türkiye (n=119)
Germany (n=30)
the Netherlands (n=53)
F
Türkiye (n=159)
Germany (n=45)
the Netherlands (n=72)
F
Height (cm)
175.4 ± 7.0
173.8 ± 6.7
173.1 ± 7.1
2.12
160.6 ± 6.4
162.3 ± 6.4
158.1 ± 6.9
6.15**
Weight (kg)
82.4 ± 13.3
83.7 ± 13.3
84.4 ± 12.9
0.45
64.8 ± 14.5
73.5 ± 14.6
75.0 ± 12.7
15.88***
BMI (kg/m²)
26.8 ± 3.9
27.6 ± 4.0
28.1 ± 4.0
1.95
25.3 ± 5.8
28.1 ± 6.0
30.0 ± 5.6
17.47***
AMA (cm²)
59.1 ± 12.4
59.4 ± 11.9
62.1 ± 11.1
1.17
37.1 ± 8.6
43.7 ± 11.8
45.7 ± 11.7
21.08***
AFA (cm²)
60.3 ± 14.1
62.2 ± 13.7
64.4 ± 17.5
1.42
57.9 ± 19.9
73.0 ± 24.0
74.6 ± 22.5
18.98***
Fat (%)
20.7 ± 6.5
25.3 ± 7.0
23.1 ± 6.9
6.68**
29.3 ± 8.5
34.3 ± 9.4
34.7 ± 9.2
11.72***
FM (kg)
17.6 ± 7.6
21.1 ± 6.7
20.0 ± 7.9
3.63*
20.0 ± 10.2
26.3 ± 11.4
26.8 ± 10.0
13.44***
FFM (kg)
64.8 ± 8.0
62.7 ± 10.0
64.2 ± 7.9
0.82
44.8 ± 5.0
47.3 ± 5.3
48.2 ± 6.3
11.25***
MM (kg)
61.2 ± 9.2
60.2 ± 8.4
61.0 ± 7.5
0.15
42.2 ± 5.7
44.8 ± 5.0
45.8 ± 6.0
11.17***
MUAC (cm)
30.3 ± 2.9
30.5 ± 2.9
31.1 ± 3.3
1.52
26.9 ± 3.7
29.7 ± 4.3
30.3 ± 4.0
23.01***
Frame Index
39.9 ± 2.7
41.2 ± 4.1
41.3 ± 2.3
5.77**
37.6 ± 3.1
38.8 ± 3.2
41.1 ± 3.4
29.81***
Note. Values are mean ± SD. *p<0.05, **p<0.01, ***p<0.001. AMA=Arm Muscle Area; AFA=Arm Fat Area; MUAC=Mid-Upper Arm Circumference; FM=Fat Mass; FFM=Fat-Free Mass; MM=Muscle Mass (kg)
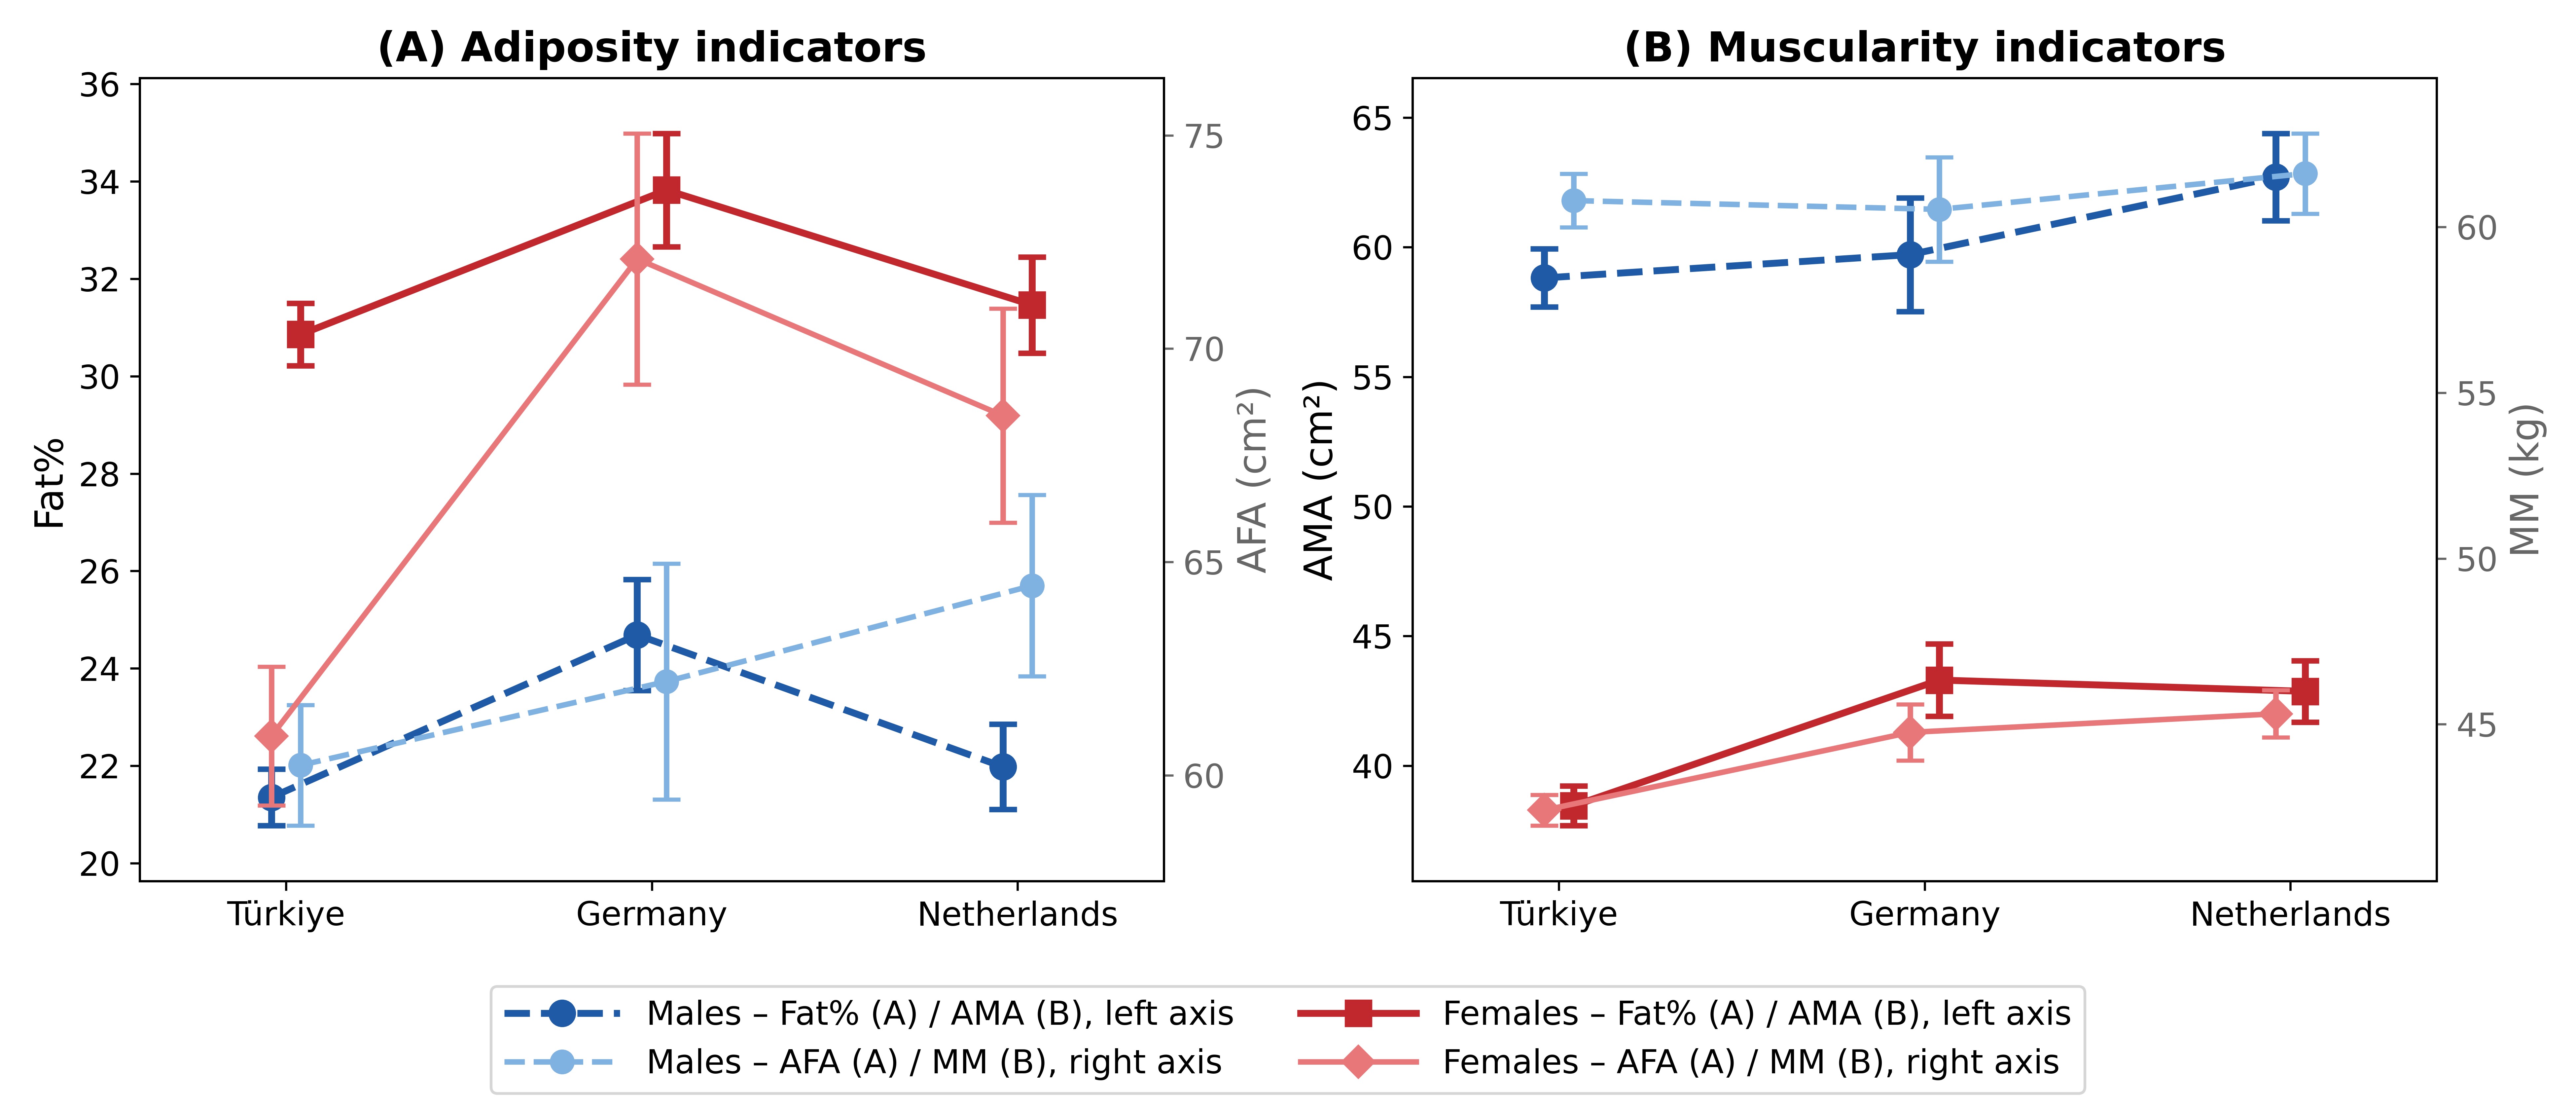
After adjusting for age, country differences in males were largely eliminated (Table 3). BMI, AMA, AFA, weight, and MM showed no significant variation across countries, indicating that the observed differences were primarily attributable to age structure. Only fat percentage retained a marginally significant effect (F=3.13, p=0.045). In females, age adjustment substantially reduced but did not eliminate country differences (Table 3). BMI was no longer significant after adjustment (F=1.96, p=0.143), indicating strong age confounding; however, AMA (F=5.74, p=0.004), AFA (F=5.63, p=0.004), MUAC (F=6.54, p=0.002), and frame index (F=6.27, p=0.002) remained significantly different across countries. FFM, MM, and FM also showed significant differences, indicating residual variation beyond age effects. Age-adjusted body composition patterns differed markedly by sex (Figure 1). Males showed largely overlapping profiles across countries for both adiposity (Fat %, AFA) and muscularity (AMA, MM), indicating minimal residual variation after adjustment. In contrast, females exhibited a clear cross-country gradient across both domains, with higher values in Germany and the Netherlands compared to Türkiye, highlighting persistent sex-specific differences beyond age effects.
Table 3 Age-adjusted anthropometric characteristics (ANCOVA) of Turks by sex and country of residence
Males
Females
Türkiye (n=119)
Germany (n=30)
Netherlands (n=53)
F
Türkiye (n=159)
Germany (n=45)
Netherlands (n=72)
F
Height (cm)
174.68 ± 0.64
174.36 ± 0.88
174.12 ± 0.79
0.14
159.65 ± 0.72
162.54 ± 1.01
160.06 ± 0.91
4.02*
Weight (kg)
82.83 ± 1.22
83.33 ± 1.75
83.64 ± 1.56
0.07
66.94 ± 1.38
72.87 ± 1.94
70.55 ± 1.73
4.20*
BMI (kg/m²)
27.20 ± 0.42
27.29 ± 0.58
27.47 ± 0.51
0.10
26.48 ± 0.44
27.74 ± 0.62
27.68 ± 0.55
1.96
AMA (cm²)
58.93 ± 1.21
59.61 ± 1.85
62.50 ± 1.62
1.62
38.74 ± 0.78
43.22 ± 1.14
42.28 ± 1.02
5.74**
AFA (cm²)
60.37 ± 1.33
62.08 ± 1.92
64.21 ± 1.74
1.19
61.42 ± 1.55
71.96 ± 2.10
67.40 ± 1.89
5.63**
Fat (%)
21.45 ± 0.71
24.67 ± 1.02
21.93 ± 0.95
3.13*
30.89 ± 0.88
33.79 ± 1.24
31.34 ± 1.10
2.39
FM (kg)
18.31 ± 0.98
20.46 ± 1.41
18.80 ± 1.27
1.07
21.75 ± 1.22
25.77 ± 1.70
23.27 ± 1.54
3.18*
FFM (kg)
64.56 ± 1.05
62.91 ± 1.52
64.59 ± 1.36
0.51
45.21 ± 0.66
47.17 ± 0.92
47.33 ± 0.83
4.72**
MM (kg)
60.79 ± 1.12
60.50 ± 1.61
61.56 ± 1.44
0.19
42.59 ± 0.73
44.70 ± 1.02
44.94 ± 0.92
5.10**
MUAC (cm)
30.25 ± 0.28
30.55 ± 0.41
31.14 ± 0.37
1.56
27.57 ± 0.36
29.54 ± 0.51
28.82 ± 0.45
6.54**
Frame Index
40.15 ± 0.31
41.00 ± 0.44
40.86 ± 0.39
1.90
38.32 ± 0.39
38.57 ± 0.55
39.75 ± 0.48
6.27**
Note. Values are mean ± SD. * p<0.05, ** p<0.01, *** p<0.001. AMA=Arm Muscle Area; AFA=Arm Fat Area; MUAC=Mid-Upper Arm Circumference; FM=Fat Mass; FFM=Fat-Free Mass; MM=Muscle Mass (kg)
Figure 1 Age-adjusted mean (± SE) (A) adiposity and (B) muscularity indicators of Turkish adults living in Türkiye, Germany and the Netherlands. Means were adjusted for age separately for each sex. Blue dashed lines with circles show males; red solid lines show females. Dark symbols refer to the left y-axis: body fat percentage (Fat%) in panel A and arm muscle area (AMA, cm²) in panel B. Light symbols refer to the right y-axis: arm fat area (AFA, cm²) in panel A and muscle mass (MM, kg) in panel B.
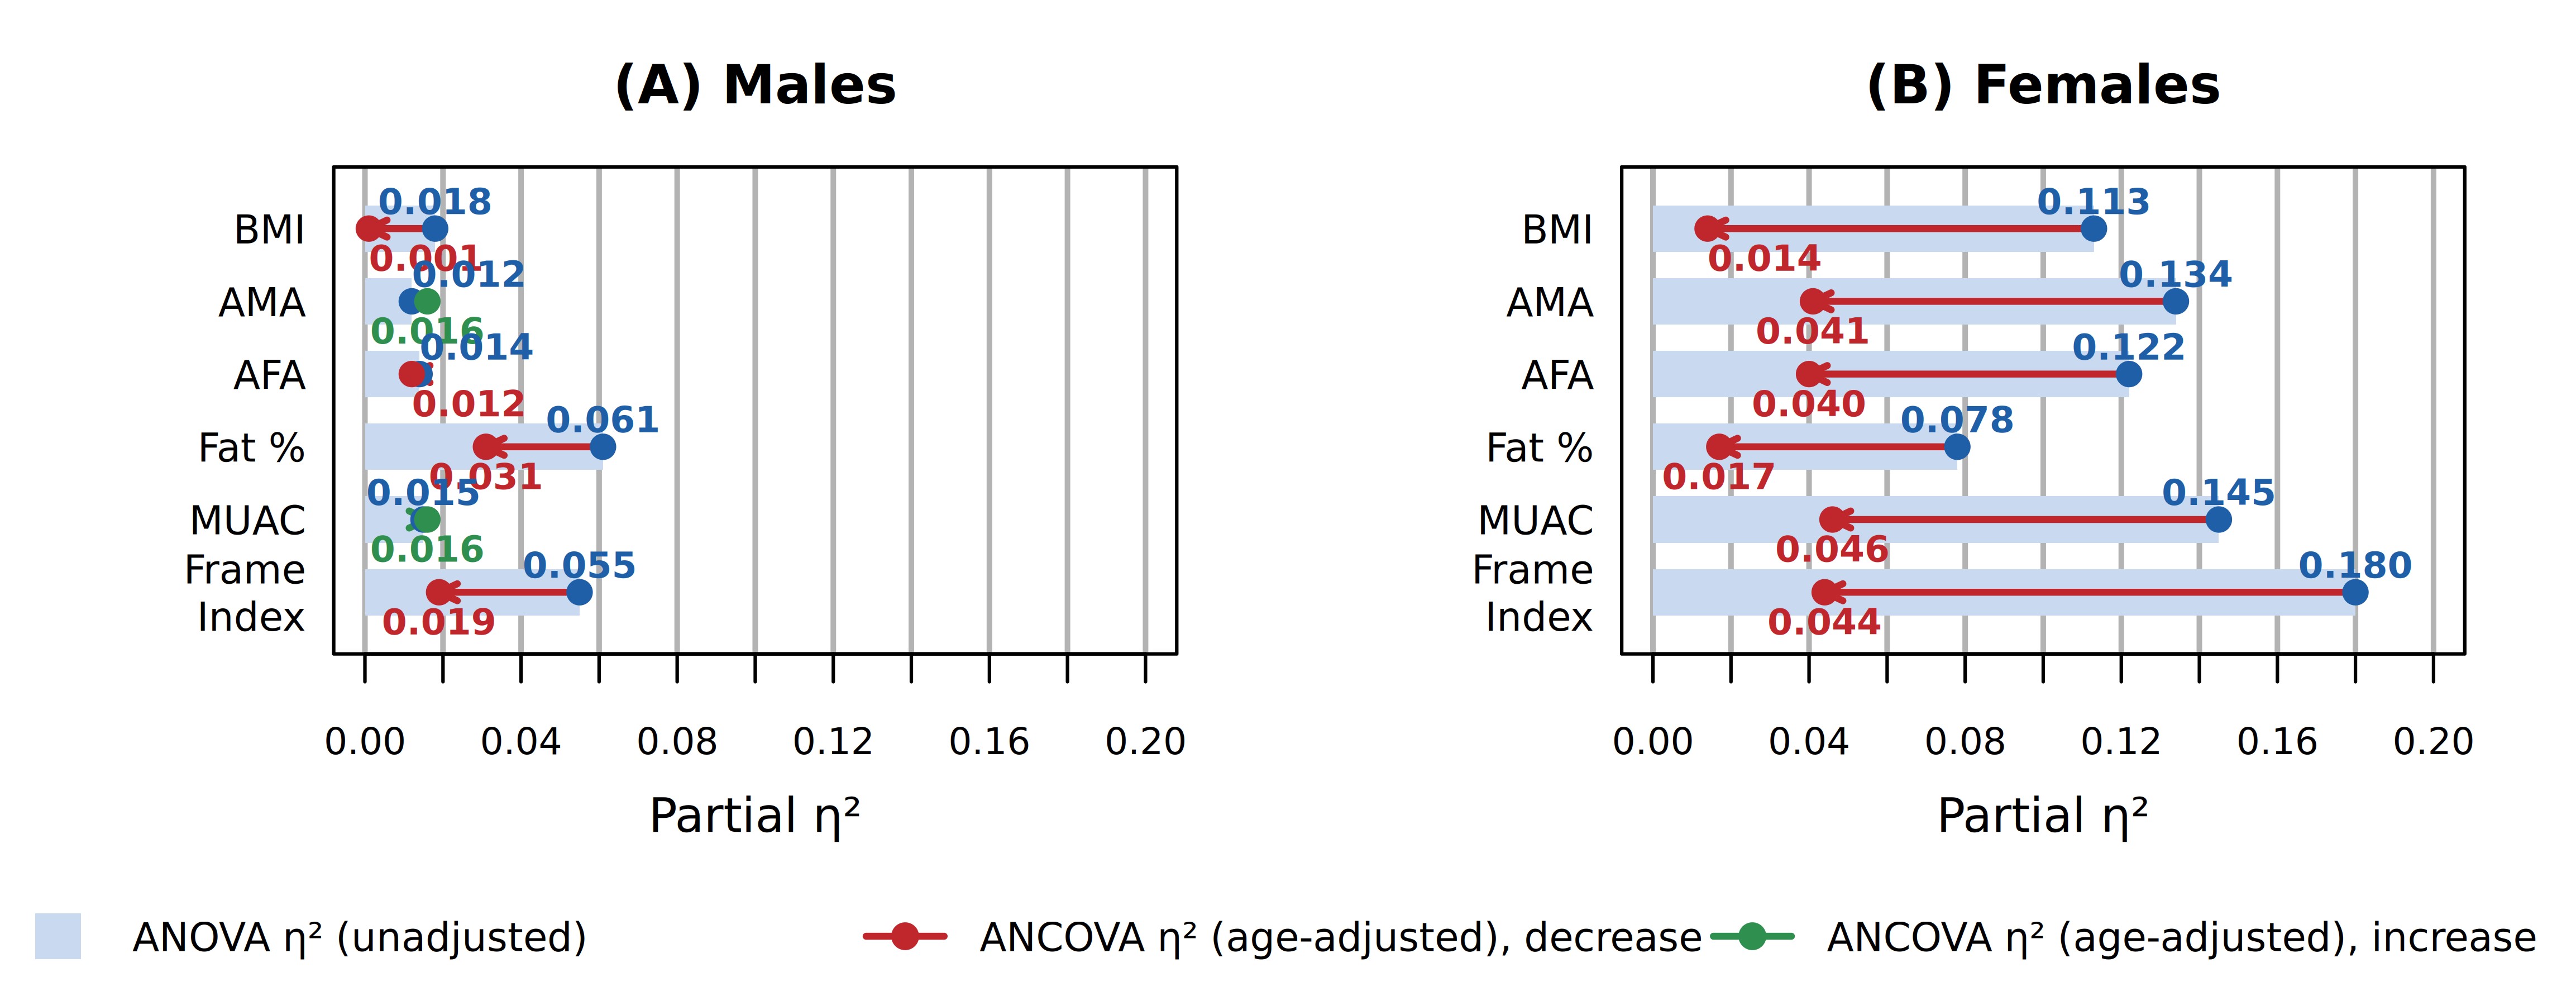
A comparison of unadjusted and age-adjusted effect sizes demonstrated substantial age confounding in both sexes, with clear sex-specific patterns (Figure 2). Effect sizes in males were markedly reduced after age adjustment, approaching zero for most variables (e.g., BMI: Δη²=−0.017; Fat %: Δη²=−0.030), with only minimal increases observed for AMA (Δη²=+0.004) and MUAC (Δη²=+0.001). In contrast, females exhibited consistent and substantial reductions across all variables, with the largest decreases observed for frame index (Δη²=−0.136), MUAC (Δη²=−0.099), and BMI (Δη²=−0.099). Despite this attenuation, meaningful residual effect sizes persisted in females, indicating that age alone does not fully account for cross-country differences in body composition. These patterns reveal a fundamental sex difference in the impact of migration: in males, cross-country variation was largely eliminated after age adjustment, indicating no distinct migrant phenotype; in females, persistent differences in both adiposity and muscularity point to additional biocultural influences operating beyond age-related changes.
Figure 2 Age confounding of cross-country body composition differences by sex. Bars show the change in partial eta squared after age adjustment (ANCOVA − ANOVA) for males (A) and females (B). In males, effect sizes collapse toward zero for nearly all variables; in females, substantial residual effects persist for AMA, AFA, MUAC, and FI, confirming that integration regime characteristics shape female body composition beyond age-related variation.
Post hoc comparisons confirmed that the observed cross-country gradient in females was primarily driven by significant differences between Germany and the Netherlands in adiposity-related measures (Fat %, AFA), whereas muscularity indicators (AMA, MM) showed weaker and less consistent differentiation between host countries.
Multiple linear regression models predicting AMA and AFA across the full sample (Table 4) confirmed the centrality of body composition parameters and sex as primary predictors. For AMA, BMI (β=0.387, p<0.001), FFM (β=0.333, p<0.001), and female sex (β=−0.366, p<0.001) were the strongest predictors, with the Netherlands emerging as a significant positive predictor (β=0.083, p=0.004). For AFA, BMI (β=0.625, p<0.001) and BF% (β=0.302, p<0.001) dominated the model, with both Germany (β=0.061, p=0.014) and the Netherlands (β=0.073, p=0.005) remaining significant positive predictors after controlling for all other variables. Age negatively predicted AFA (β=−0.151, p<0.001), consistent with the strong age confounding observed in ANCOVA. Overall model fit was strong for both outcomes (AMA: R²=0.703; AFA: R²=0.747).
Table 4 Multiple linear regression predicting AMA and AFA: full sample (n=476) of Turkish migrants in Germany and the Netherlands as well as Turkish people living in Türkiye
Predictor
AMA (cm²)
AFA (cm²)
B
beta
p
B
beta
p
BMI
1.080
0.387
0.000***
2.332
0.625
0.000***
BF%
−0.015
−0.009
0.862
0.630
0.302
0.000***
FFM (kg)
0.436
0.333
0.000***
0.289
0.165
0.003**
Age
−0.063
−0.057
0.072
−0.223
−0.151
0.000***
Sex (female)
−11.014
−0.366
0.000***
3.649
0.091
0.042*
Germany
2.134
0.052
0.052
3.328
0.061
0.014*
Netherlands
2.792
0.083
0.004**
3.311
0.073
0.005**
Model fit
R²=0.703, F(7,468)=158.05, p<0.001
R²=0.747, F(7,468)=196.91, p<0.001
Note. B=unstandardised coefficient; beta=standardised coefficient. Sex coded female=1, male=0. Country: Türkiye=reference category. Model controls for BMI, body fat percentage (BF%), fat-free mass (FFM), age, sex, and country of residence. * p<0.05, ** p<0.01, *** p<0.001. Highlighted cells indicate significant predictors.
Hierarchical regression in females (Table 5) examined whether the country effect on body composition persisted after sequential control for age, sociodemographic factors, and behavioural variables. Block 1 (age) explained 22.8% of variance in AMA and 21.5% in AFA. The addition of sociodemographic variables in Block 2 produced significant increments (AMA: ΔR²=0.070, F(2, 241)=12.03, p<0.001; AFA: ΔR²=0.044, F(2, 241)=7.23, p=0.001), with education emerging as a strong negative predictor in both models (AMA: β=−0.335; AFA: β=−0.273; both p<0.001). Block 3 (behavioural variables) did not contribute significantly to either outcome (p>0.60 for both). Block 4 revealed that country of residence — as a proxy for integration policy context — contributed a significant increment for AFA (ΔR²=0.025, F(2, 236)=4.15, p=0.017) and a marginal increment for AMA (ΔR²=0.015, F(2, 236)=2.66, p=0.072). Specifically, residence in Germany was a significant predictor of both elevated AFA (B=11.564, β=0.168, p=0.005) and higher AMA (B=4.052, β=0.128, p=0.031), even after accounting for age, education, income, and behavioural factors. These findings indicate that country of residence — for which integration policy context is one plausible, though unmeasured, explanatory factor — is independently associated with female body composition beyond that attributable to sociodemographic and behavioural pathways.
Table 5 Hierarchical multiple regression predicting arm muscle area (AMA) and arm fat area (AFA) in female Turkish migrants (n=245) in Germany and the Netherlands
Predictor
AMA (cm²)
AFA (cm²)
B
beta
p
B
beta
p
Block 1: Age AMA: R²=0.228 AFA: R²=0.215
Age
0.387
0.477
.000***
0.813
0.464
0.000***
Block 2:+Sociodemographic (education, income) AMA: R²=0.298 | triangle cap R squared=+0.070 | F=F(2,241)=12.03, p=0.000 * AFA: R²=0.260 | triangle cap R squared=+0.044 | F=F(2,241)=7.23, p=0.001 *
Age
0.236
0.291
0.000***
0.548
0.313
0.000***
Education
−4.198
−0.335
0.000***
−7.400
−0.273
0.000***
Income
−0.580
−0.041
0.479
−1.845
−0.061
0.312
Block 3:+Behavioural (physical activity, smoking, alcohol) AMA: R²=0.301 | triangle cap R squared=+0.003 | F=F(3,238)=0.29, p=0.831 AFA: R²=0.265 | triangle cap R squared=+0.005 | F=F(3,238)=0.58, p=0.629
Age
0.233
0.287
0.000***
0.521
0.297
0.000***
Education
−4.210
−0.336
0.000***
−6.863
−0.253
0.001***
Income
−0.568
−0.040
0.491
−1.808
−0.060
0.323
Physical activity
0.496
0.021
0.707
1.202
0.024
0.682
Smoking
1.201
0.050
0.388
−1.664
−0.032
0.589
Alcohol
0.049
0.002
0.972
2.822
0.057
0.369
Block 4:+Country of residence (integration policy context) AMA: R²=0.316 | triangle cap R squared=+0.015 | F=F(2,236)=2.66, p=0.072 AFA: R²=0.290 | triangle cap R squared=+0.025 | F=F(2,236)=4.15, p=0.017 *
Age
0.230
0.284
0.000***
0.521
0.297
0.000***
Education
−3.611
−0.288
0.000***
−5.393
−0.199
0.012*
Income
−0.143
−0.010
0.865
−0.684
−0.023
0.712
Physical activity
−0.117
−0.005
0.931
−0.391
−0.008
0.895
Smoking
0.976
0.040
0.481
−2.314
−0.044
0.449
Alcohol
−0.568
−0.025
0.692
1.209
0.024
0.702
Germany
4.052
0.128
0.031*
11.564
0.168
0.005**
Netherlands
2.423
0.101
0.142
5.610
0.108
0.123
Note. B=unstandardised regression coefficient;beta=standardised coefficient. Predictors entered in four sequential blocks. Block 1: age. Block 2: age+education+income. Block 3: Block 2+physical activity, smoking, alcohol. Block 4: Block 3+country of residence. Reference category: Türkiye. Germany reflects integration-oriented policy; the Netherlands reflect multicultural policy. triangle cap R squared and F-change statistics indicate the incremental variance explained by each block. Yellow shading highlights country predictors. Green shading indicates statistically significant predictors. * p<0.05, ** p<0.01, *** p<0.001.
Principal component regression (PCR) identified three components with eigenvalues exceeding 1.0, collectively explaining 76.01% of the total variance in the predictor set (Table 6). PC1 captured a general adiposity dimension (BMI, FM, BF%, MUAC; 37.59%), PC2 reflected a sex and lean mass dimension (Sex, FFM, AFI; 26.44%), and PC3 constituted a dimension defined statistically by country of residence, which we refer to descriptively as a "country/integration policy" dimension (Germany: loading=−0.61; Netherlands: loading=+0.66; 11.98%). All three components were significant predictors of both AMA and AFA (all p<0.001). Notably, PC3 was a significant independent predictor of both AMA (B=−1.523, t=−6.08, p<0.001) and AFA (B=−2.856, t=−7.88, p<0.001). The negative regression coefficients for PC3 reflect the component's internal structure: Germany loaded negatively (−0.61) and the Netherlands positively (+0.66) on PC3, meaning that higher PC3 scores are associated with the Dutch pattern and lower scores with the German pattern. Because PC3 negatively predicts AMA and AFA, this indicates that the German pattern (lower PC3 scores) is associated with higher AMA and AFA — consistent with the descriptive finding that age-adjusted AMA was higher among German females (43.22 cm²) than among Turkish females (38.74 cm²). The sign reversal relative to raw group means is a mathematical consequence of the component's directional coding and does not contradict the descriptive results.
Table 6 Principal component regression predicting AMA and AFA (n=476): component structure matrix and regression results confirming integration policy context (PC3) as a distinct and significant predictor of both outcomes Turkish males and females living in Germany and in the Netherlands.
Panel A. Component Structure Matrix
Variable
PC1
PC2
PC3
Age
0.301
0.013
0.282
Sex
0.085
0.539
0.071
BMI
0.452
-0.132
-0.075
BF%
0.417
0.252
-0.080
FFM
0.058
-0.530
-0.145
FM
0.462
0.043
-0.143
AFI
0.241
0.437
-0.053
FI
0.288
-0.254
0.168
MUAC
0.369
-0.285
-0.145
Germany
0.062
0.036
-0.613
Netherlands
0.162
-0.084
0.659
Eigenvalue
4.144
2.914
1.320
% Variance
37.59
26.44
11.98
Cumulative %
37.59
64.03
76.01
Panel B. PCR Regression Results
Component
AMA (cm²)
AFA (cm²)
B
t
p
B
t
p
PC1 (General Adiposity)
2.559
18.09
<0.001
8.478
41.47
<0.001
PC2 (Sex / Lean Mass)
−7.209
−42.72
<0.001
−1.116
−4.58
<0.001
PC3 (Country / Policy)
−1.523
−6.08
<0.001
−2.856
−7.88
<0.001
Model fit
R²=0.823, F(3,472)=729.76, p<0.001
R²=0.793, F(3,472)=600.80, p<0.001
Note. Panel A shows component loadings from principal component analysis of 11 predictor variables (Kaiser criterion: eigenvalue >1.0). Components are unrotated. PC1=general adiposity dimension; PC2=sex and lean mass dimension; PC3=country/integration policy dimension. Panel B shows unstandardised regression coefficients (B) and t-statistics from regressing component scores on AMA and AFA. AMA=Arm Muscle Area; AFA=Arm Fat Area; AFI=Arm Fat Index; FI=Frame Index; MUAC=Mid-Upper Arm Circumference; FFM=Fat-Free Mass; FM=Fat Mass; BF%=Body Fat Percentage. All components significant at p<0.001.
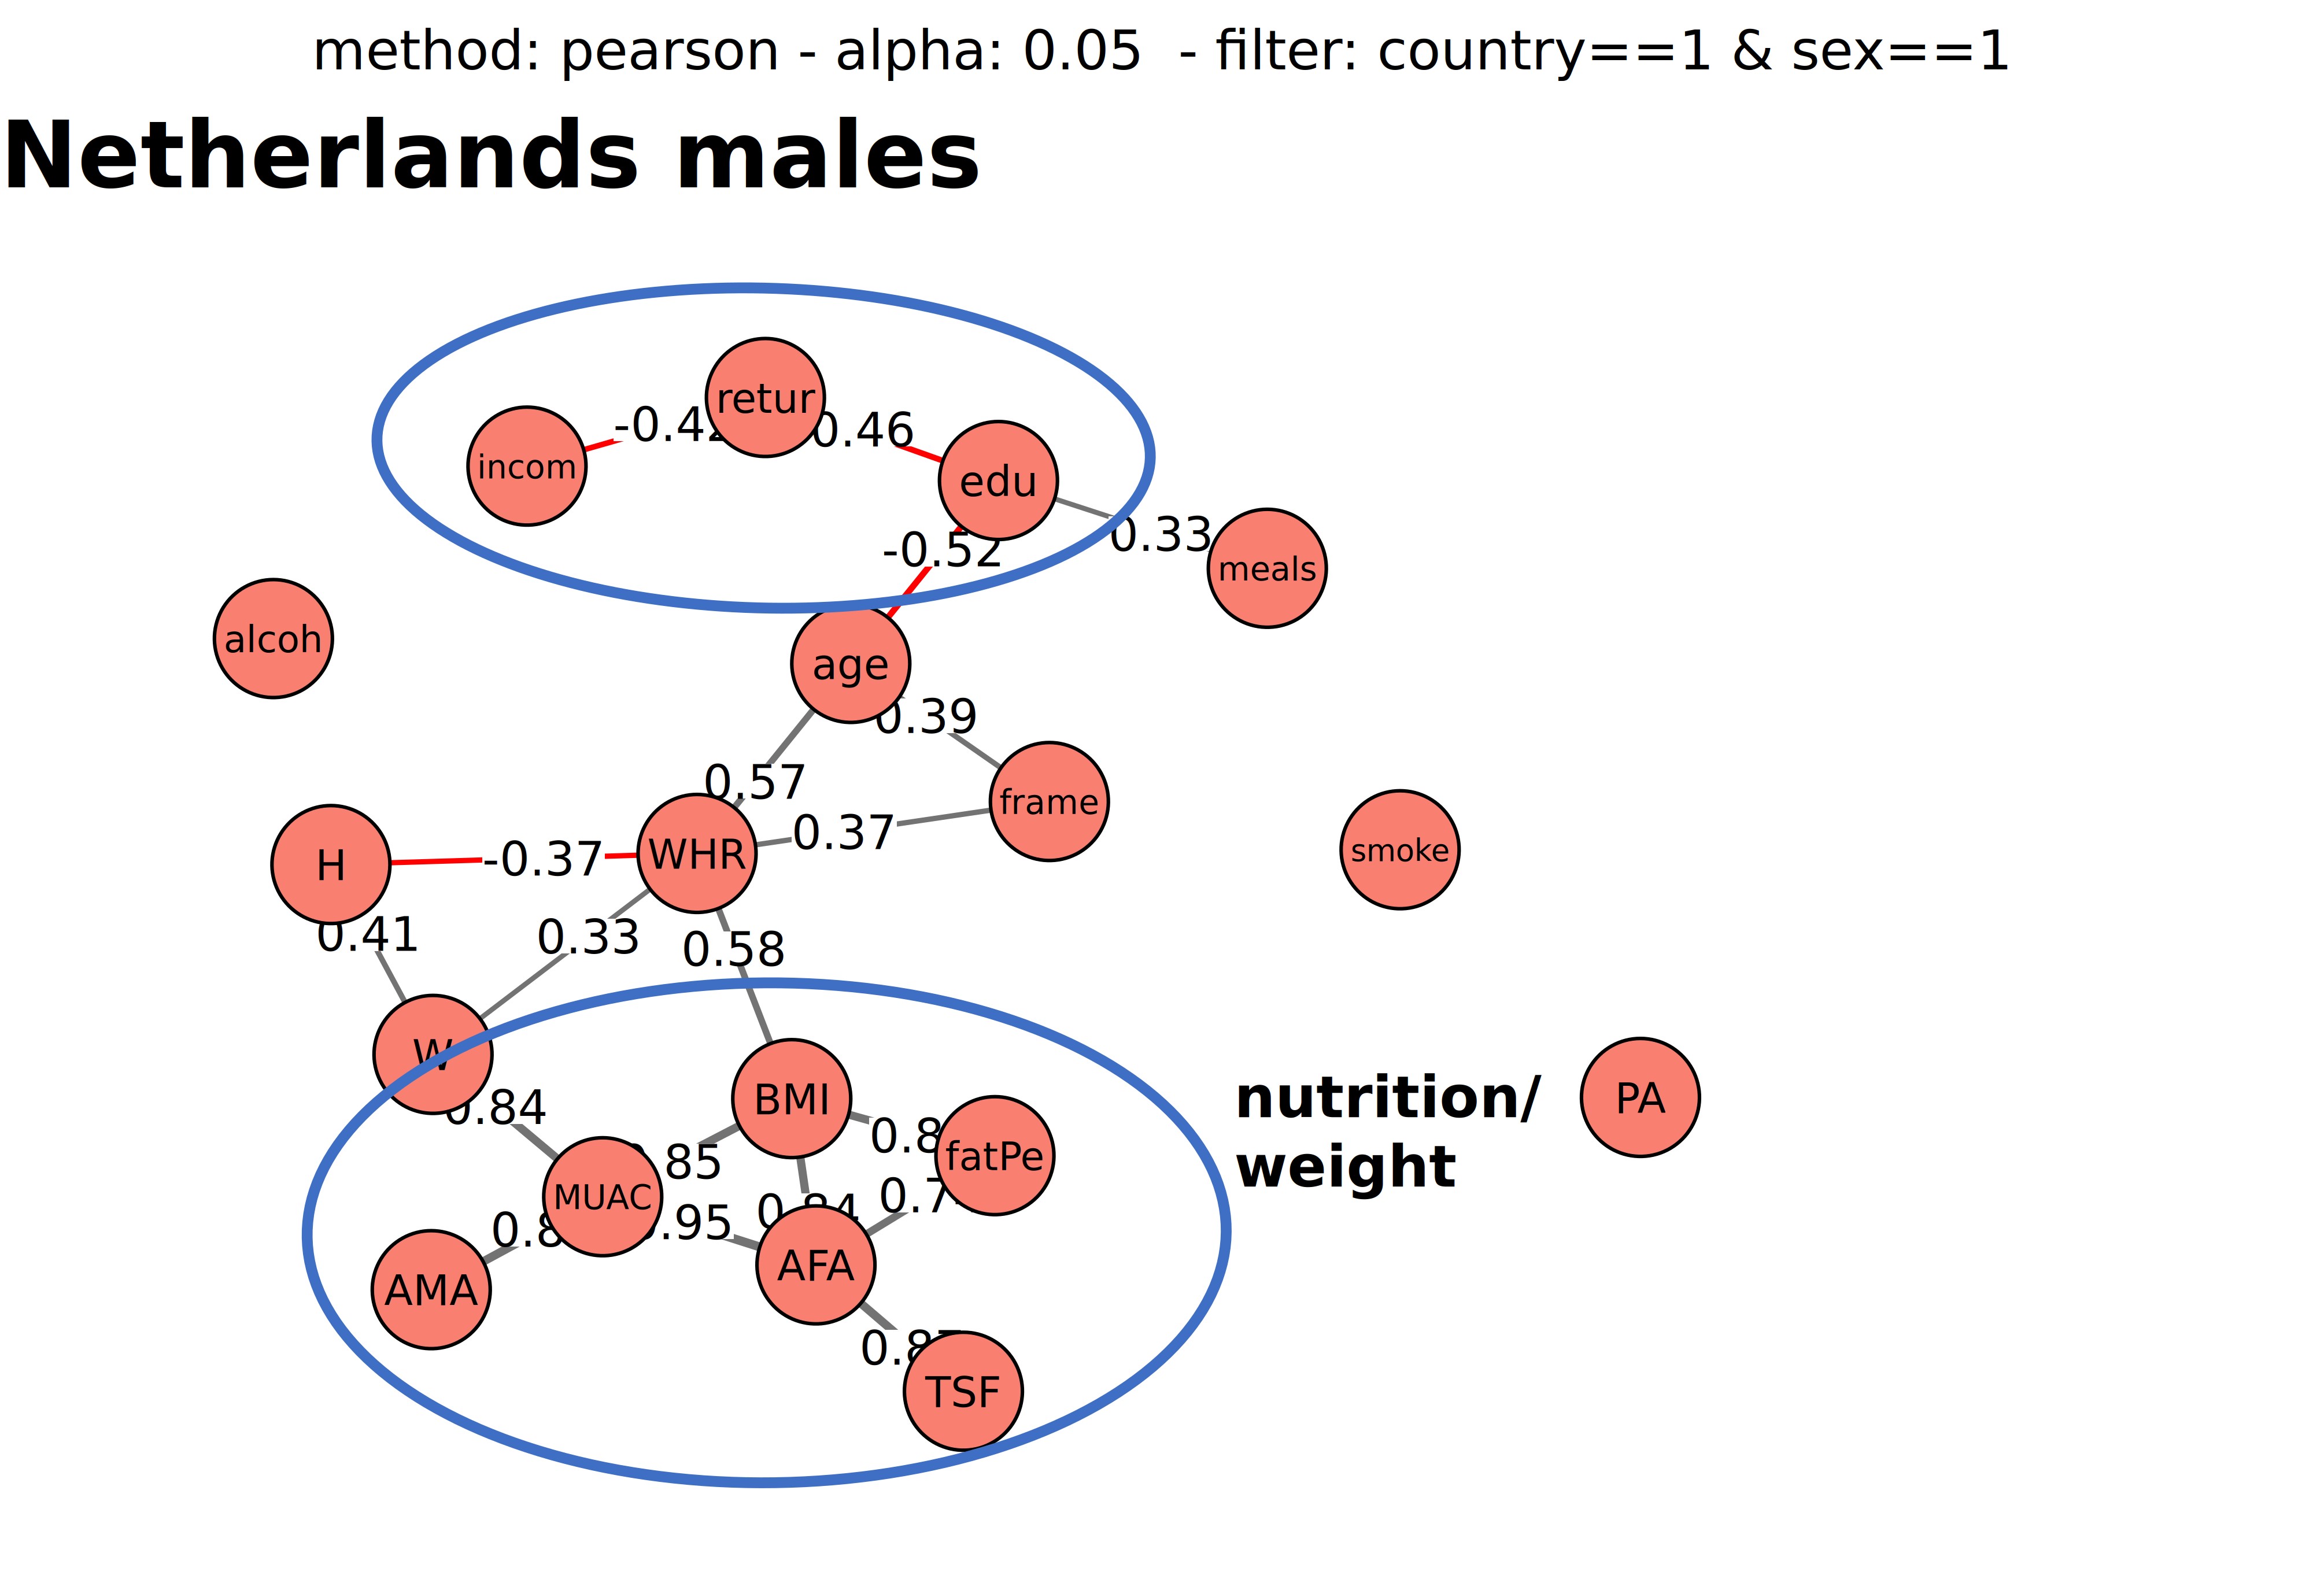
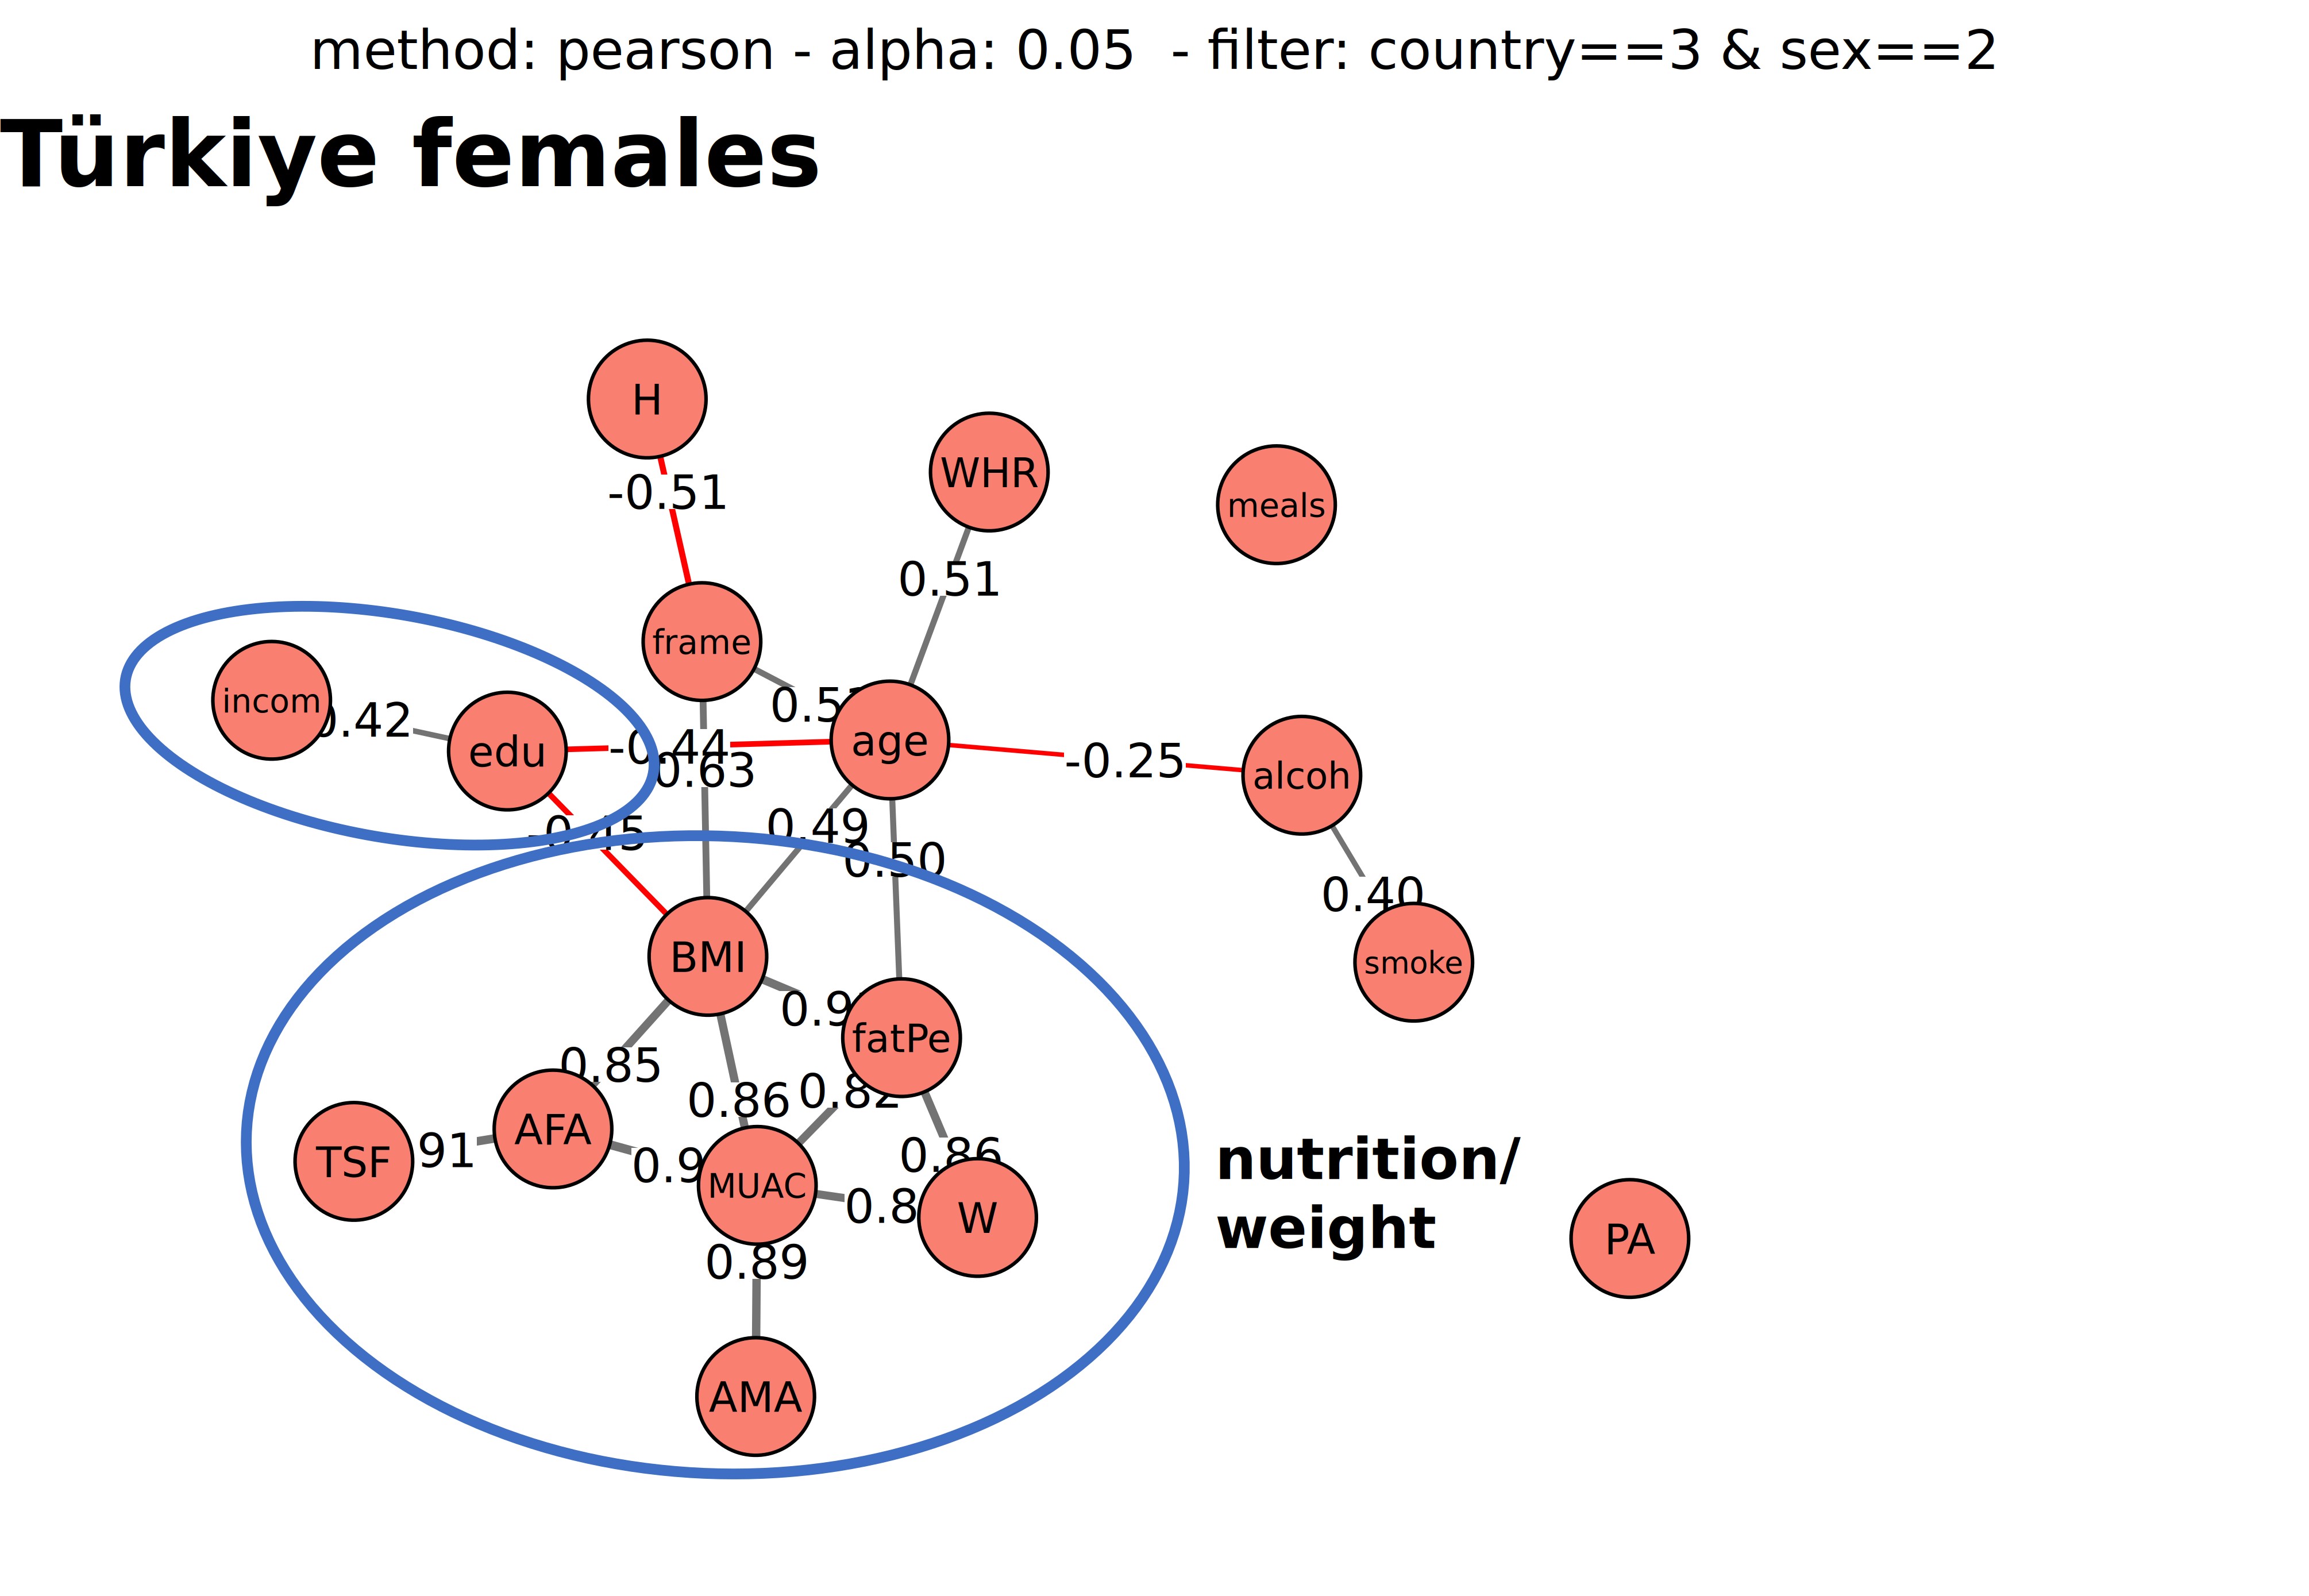
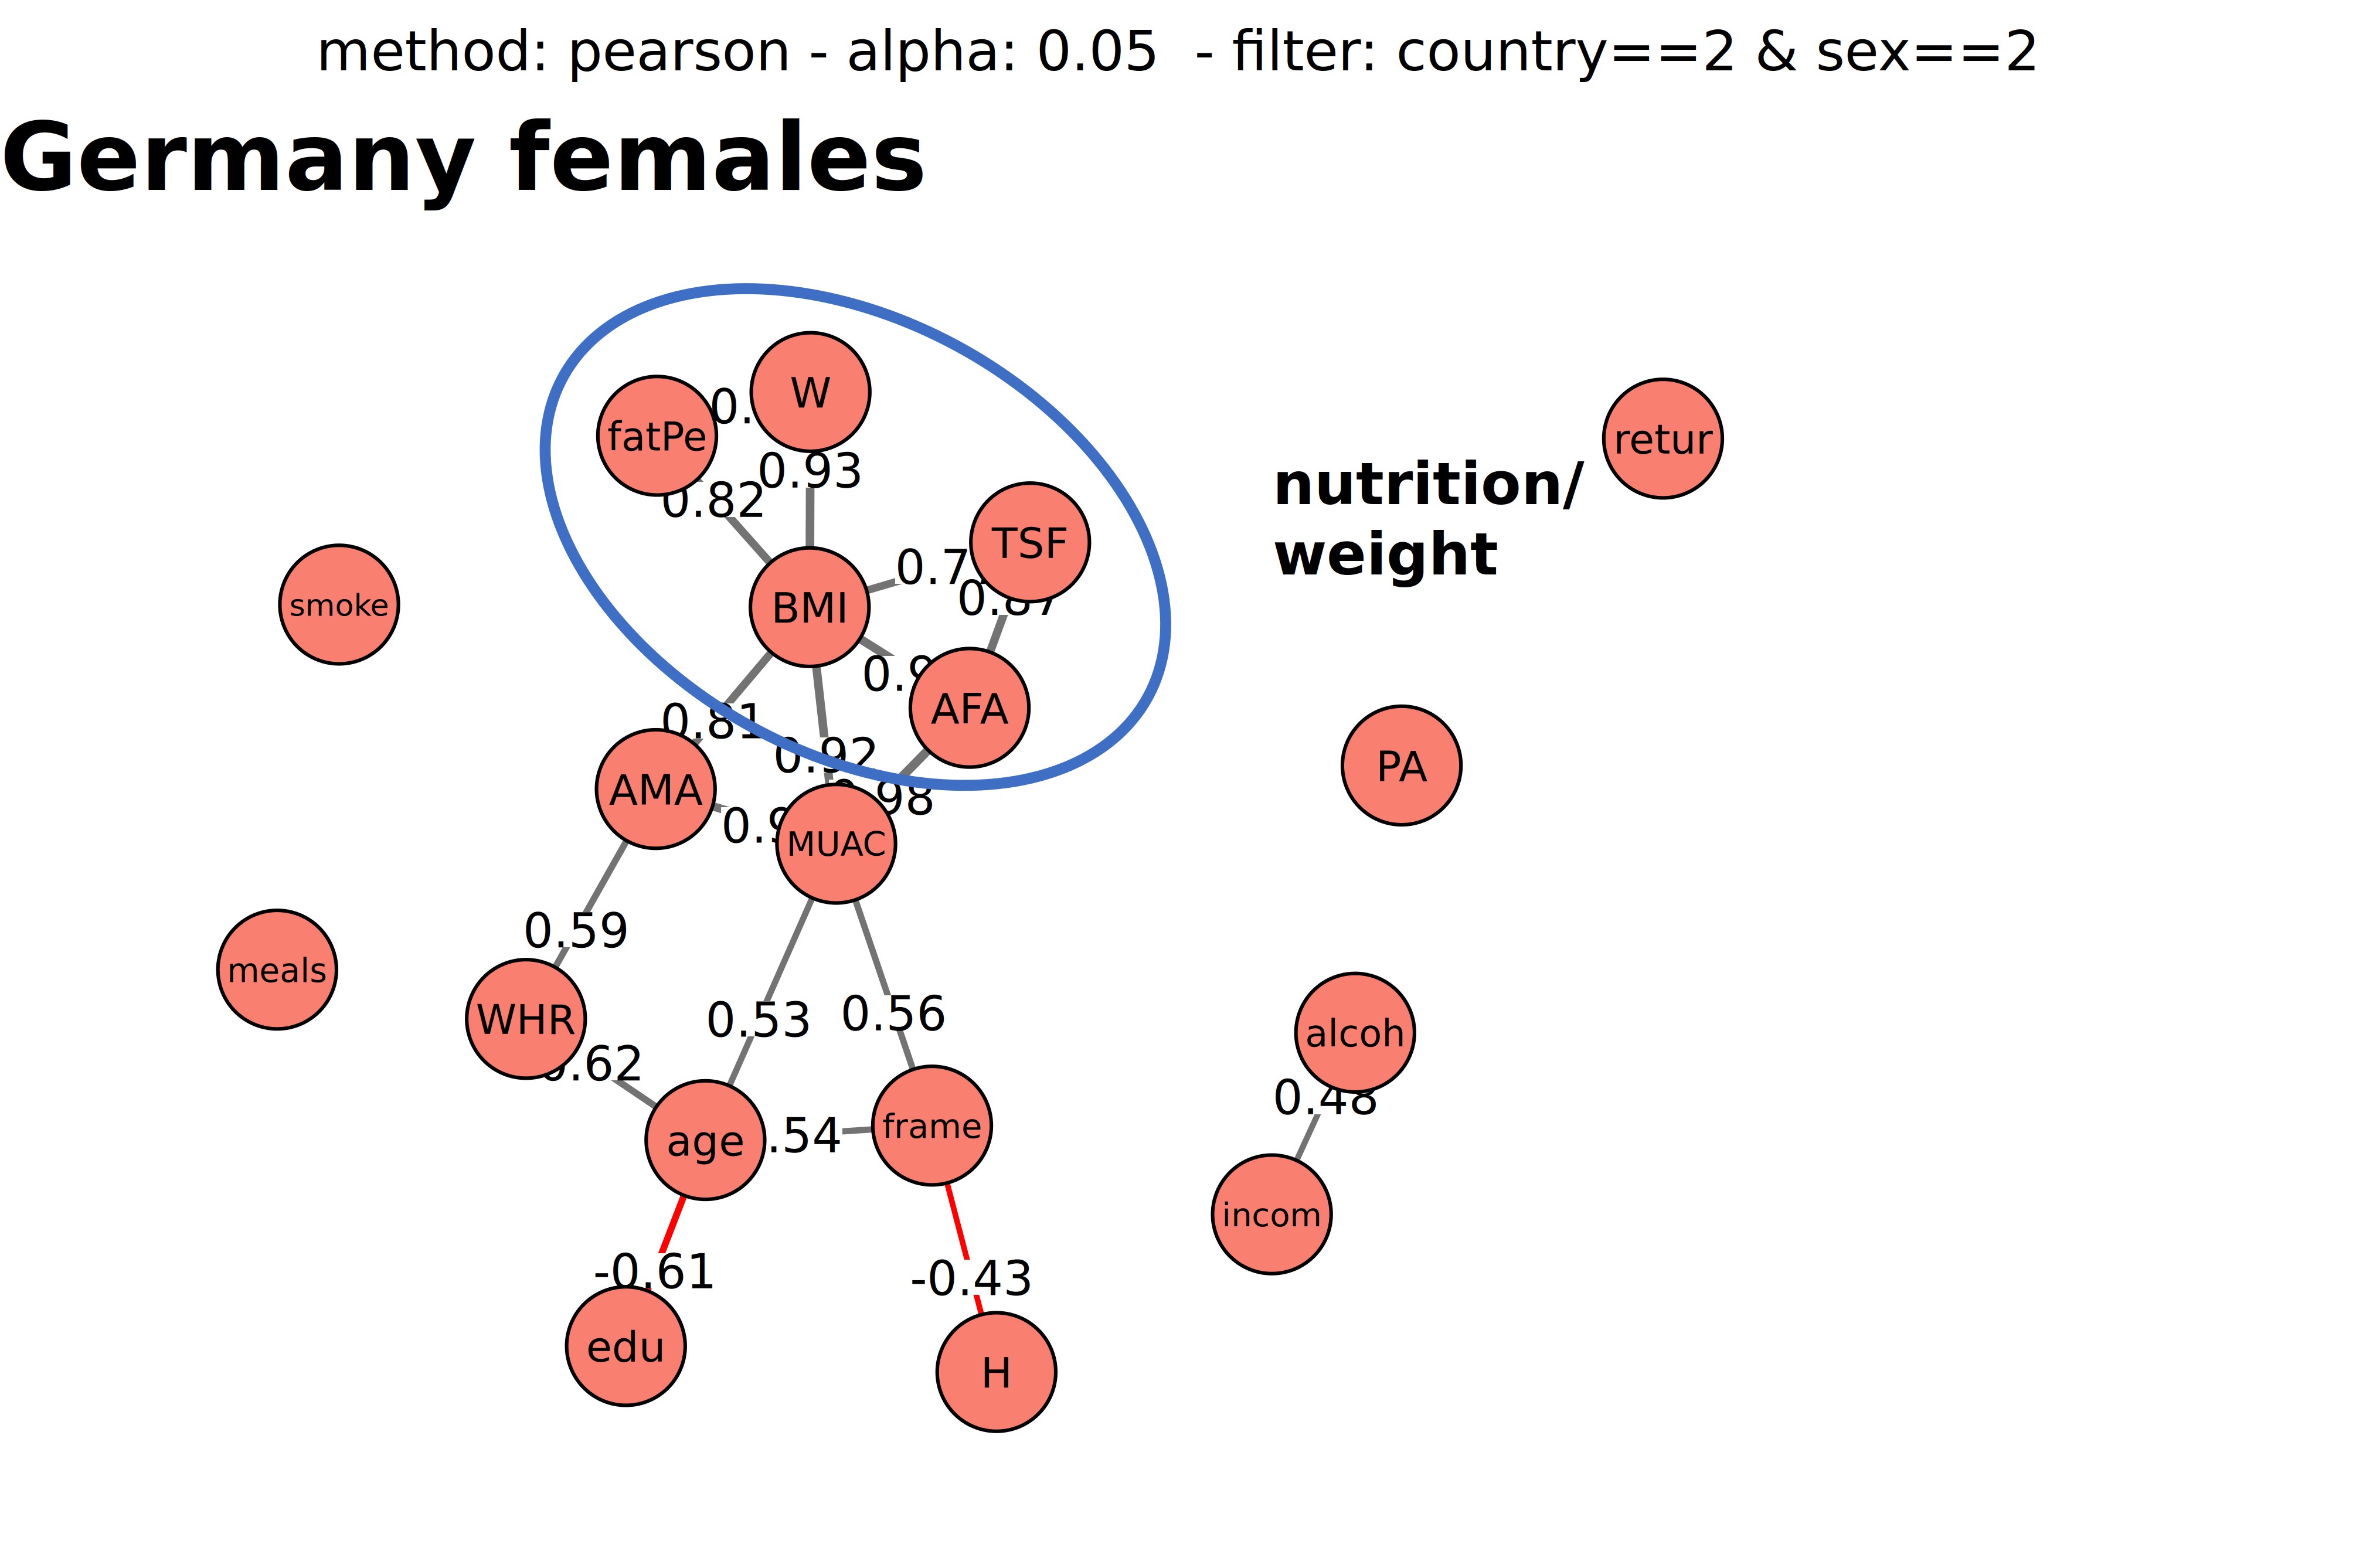
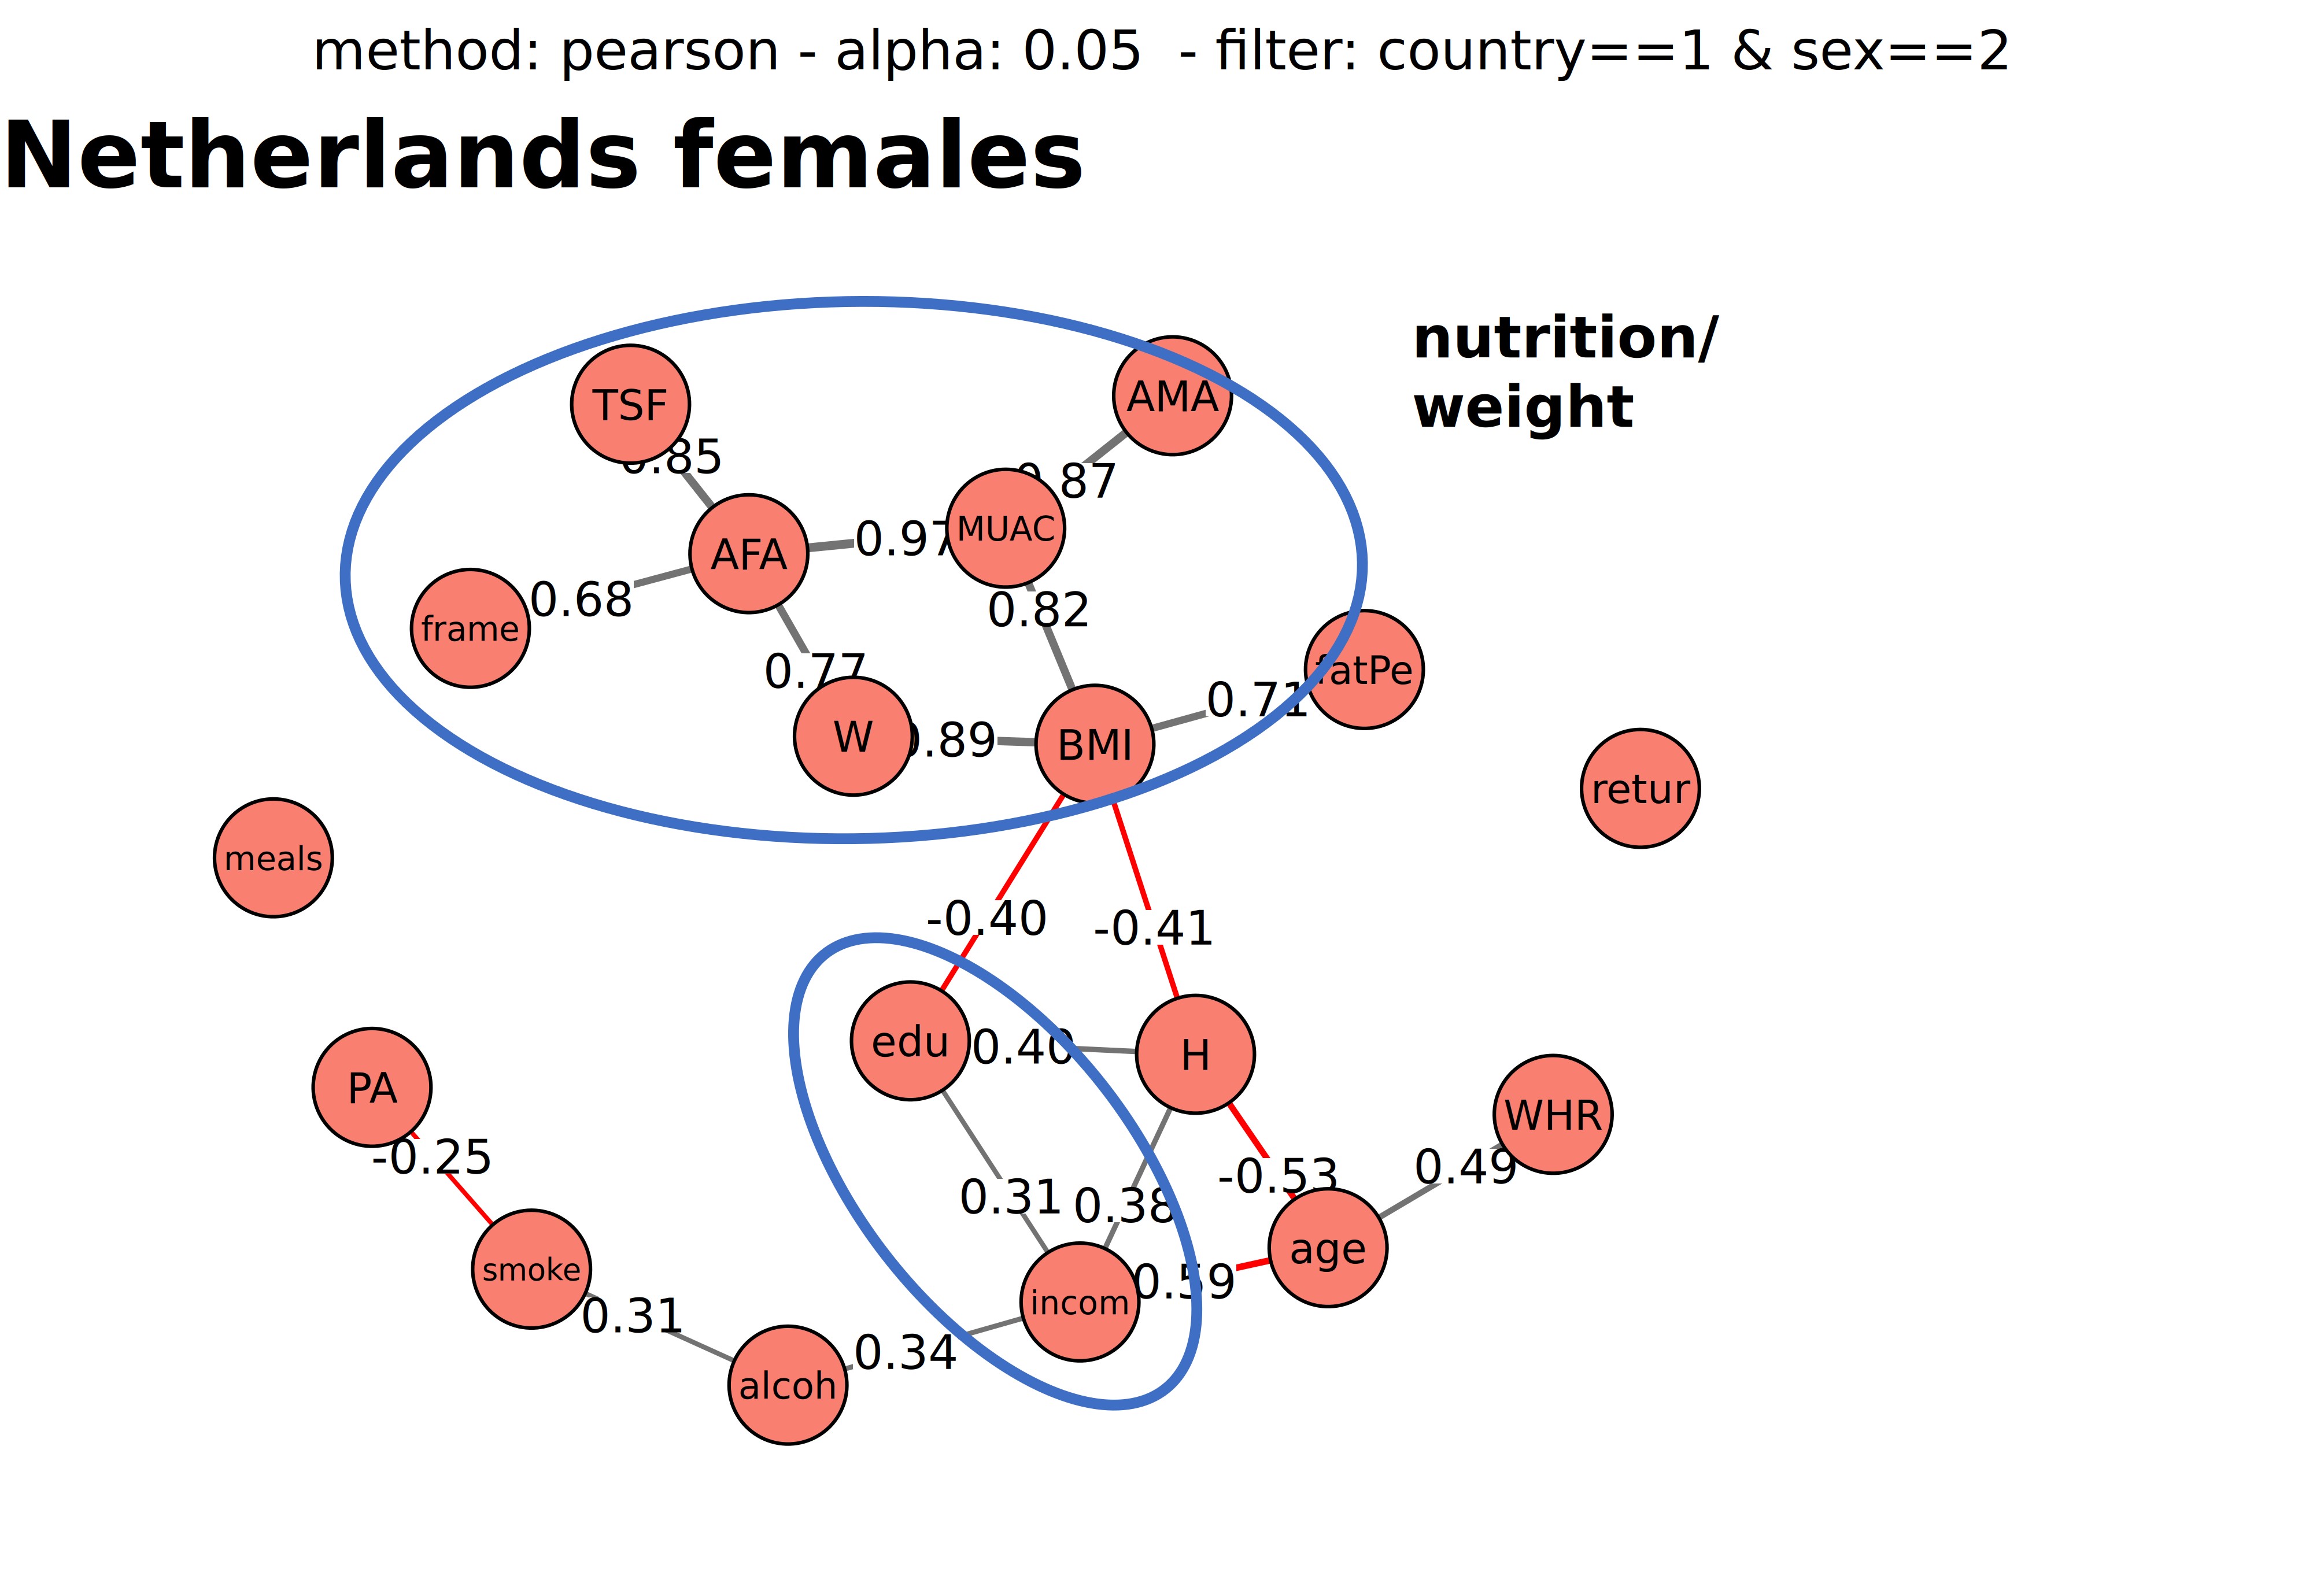
SNHA correlation networks revealed distinct association structures across all six sex-by-country subgroups, with a consistent core pattern and meaningful variation in peripheral organisation (Figures 3 – 8). Nutrition/weight clusters. In every subgroup, a coherent nutrition/weight cluster emerged comprising BMI, W, Fat%, AFA, TSF and MUAC, with positive edge weights ranging from r=0.68 to r=0.97. AMA was attached to this cluster in most subgroups. Notably, WHR did not belong to this core cluster in any group. In Turkish males, WHR connected peripherally to BMI (r=0.32); in Turkish and Dutch females and in Dutch males, WHR associated with age rather than with the adiposity variables, suggesting that WHR reflects age-related body shape changes in these groups rather than general adiposity.
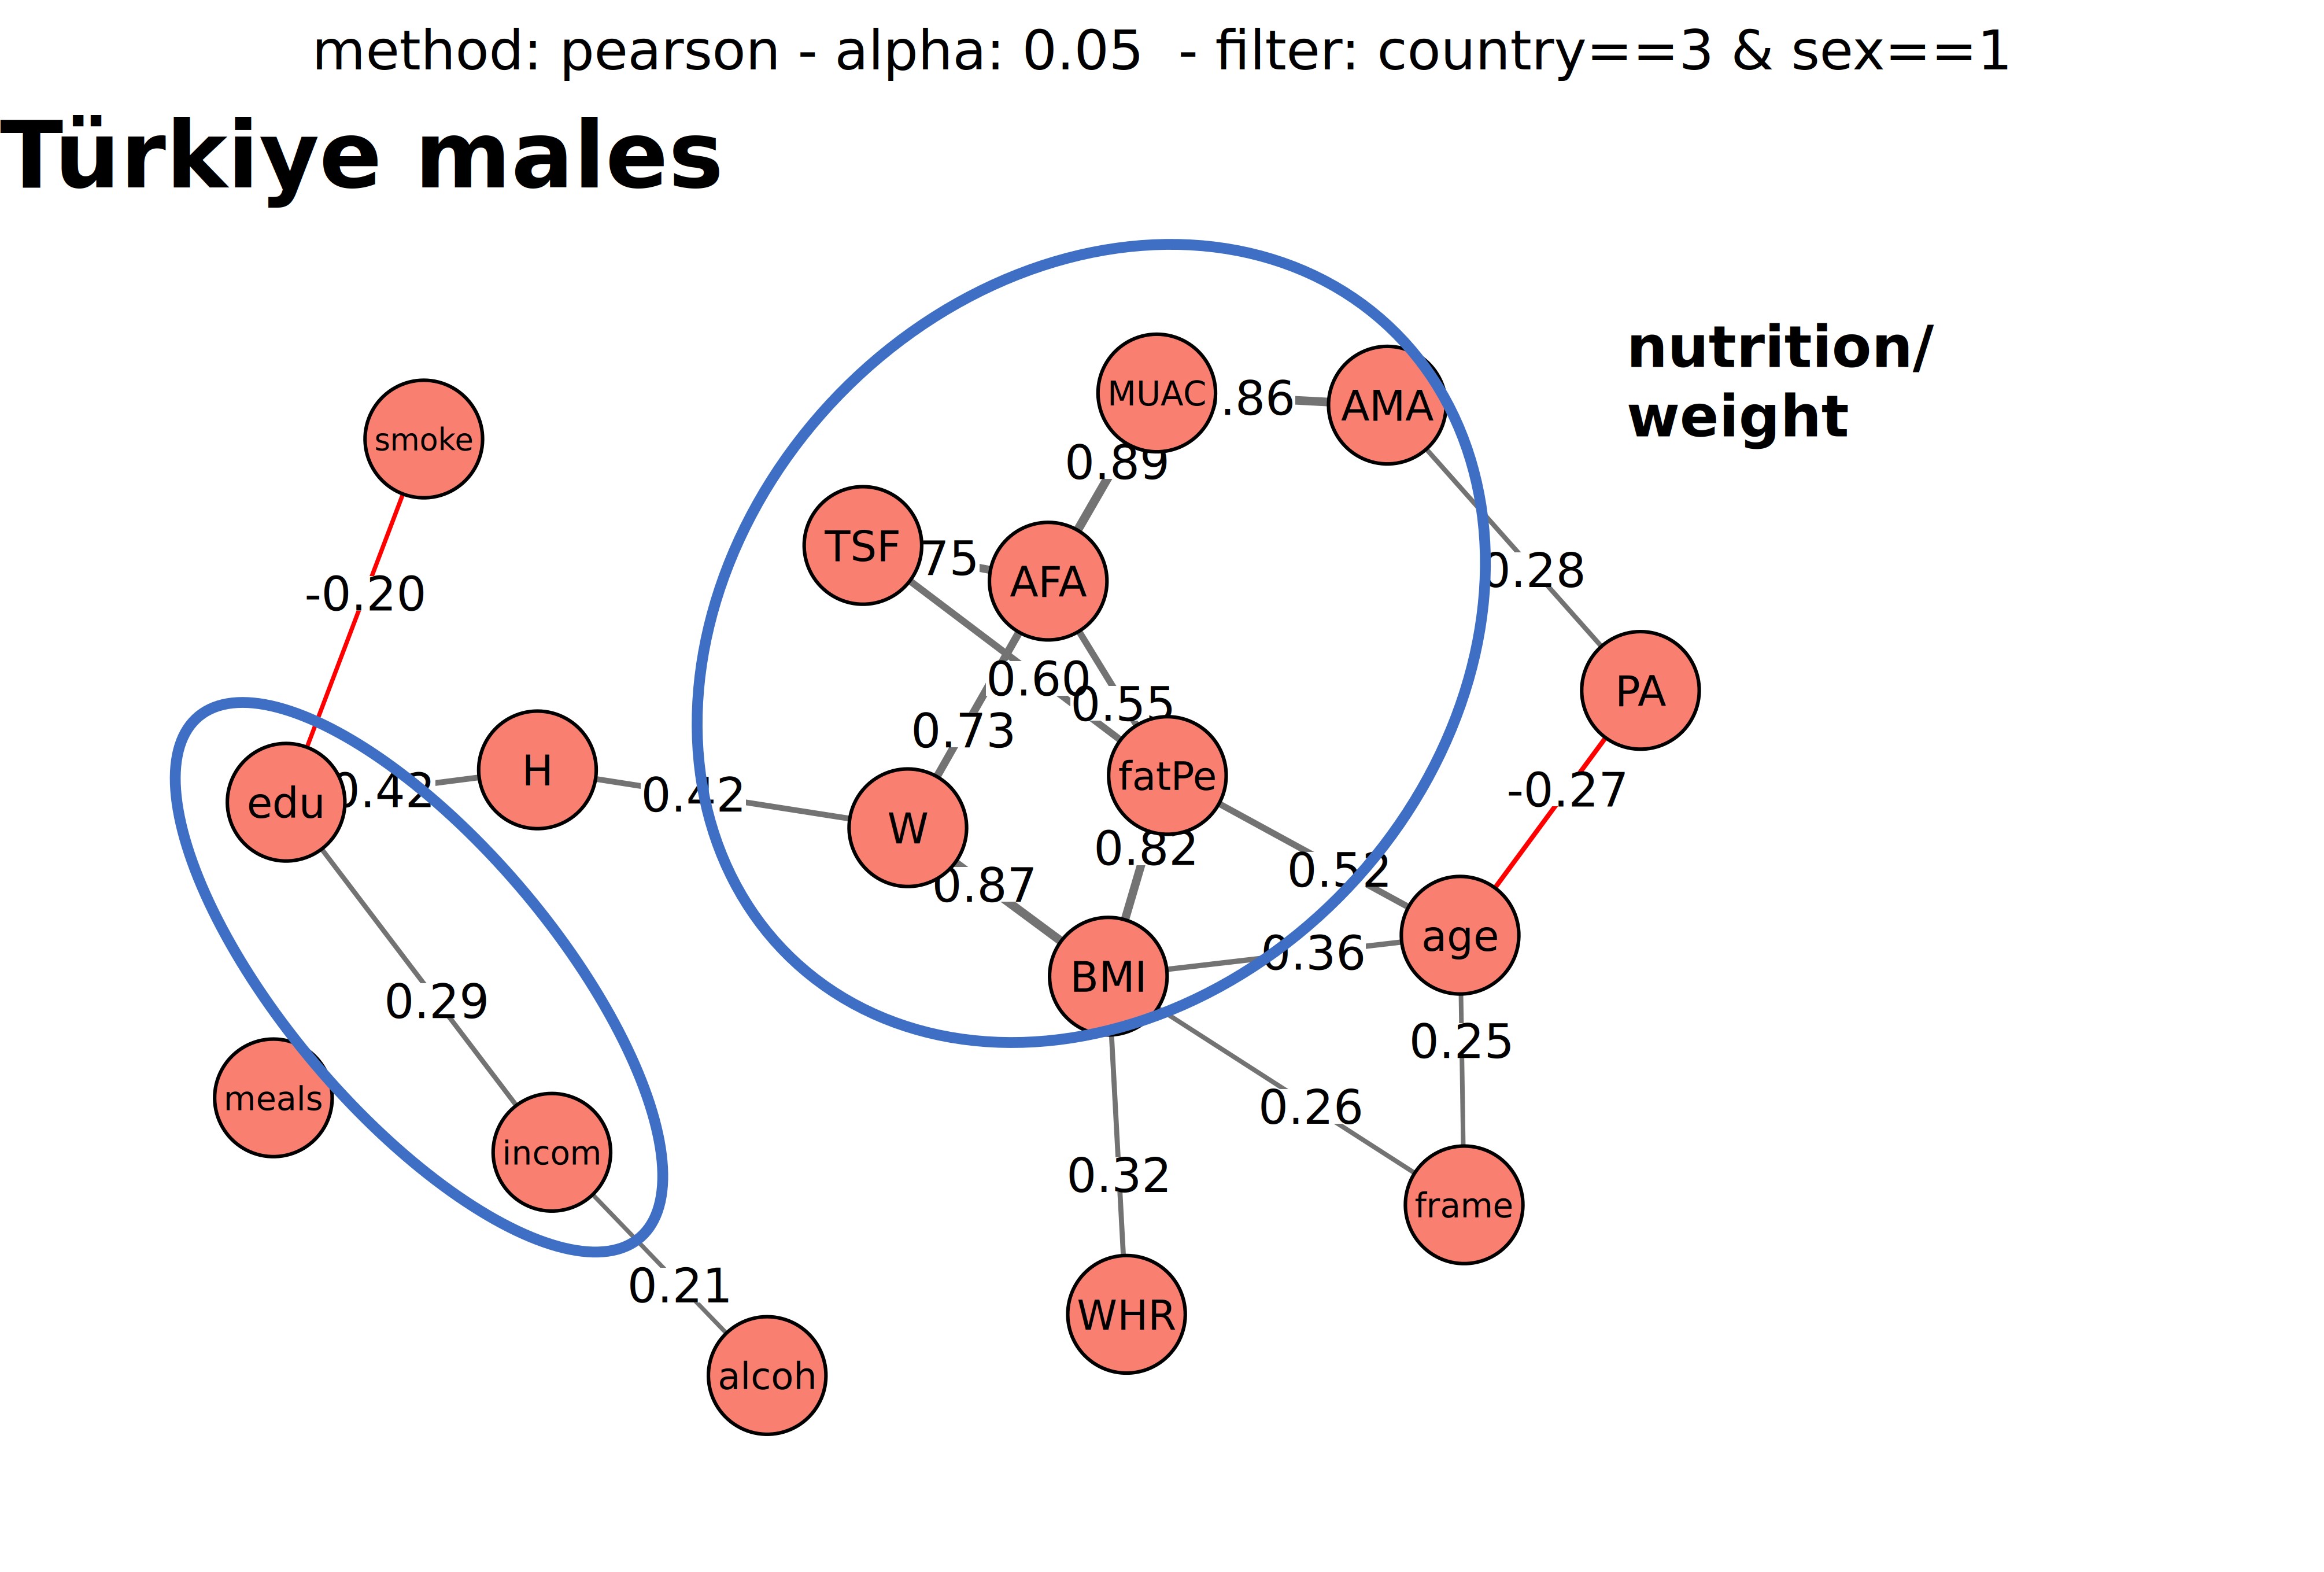
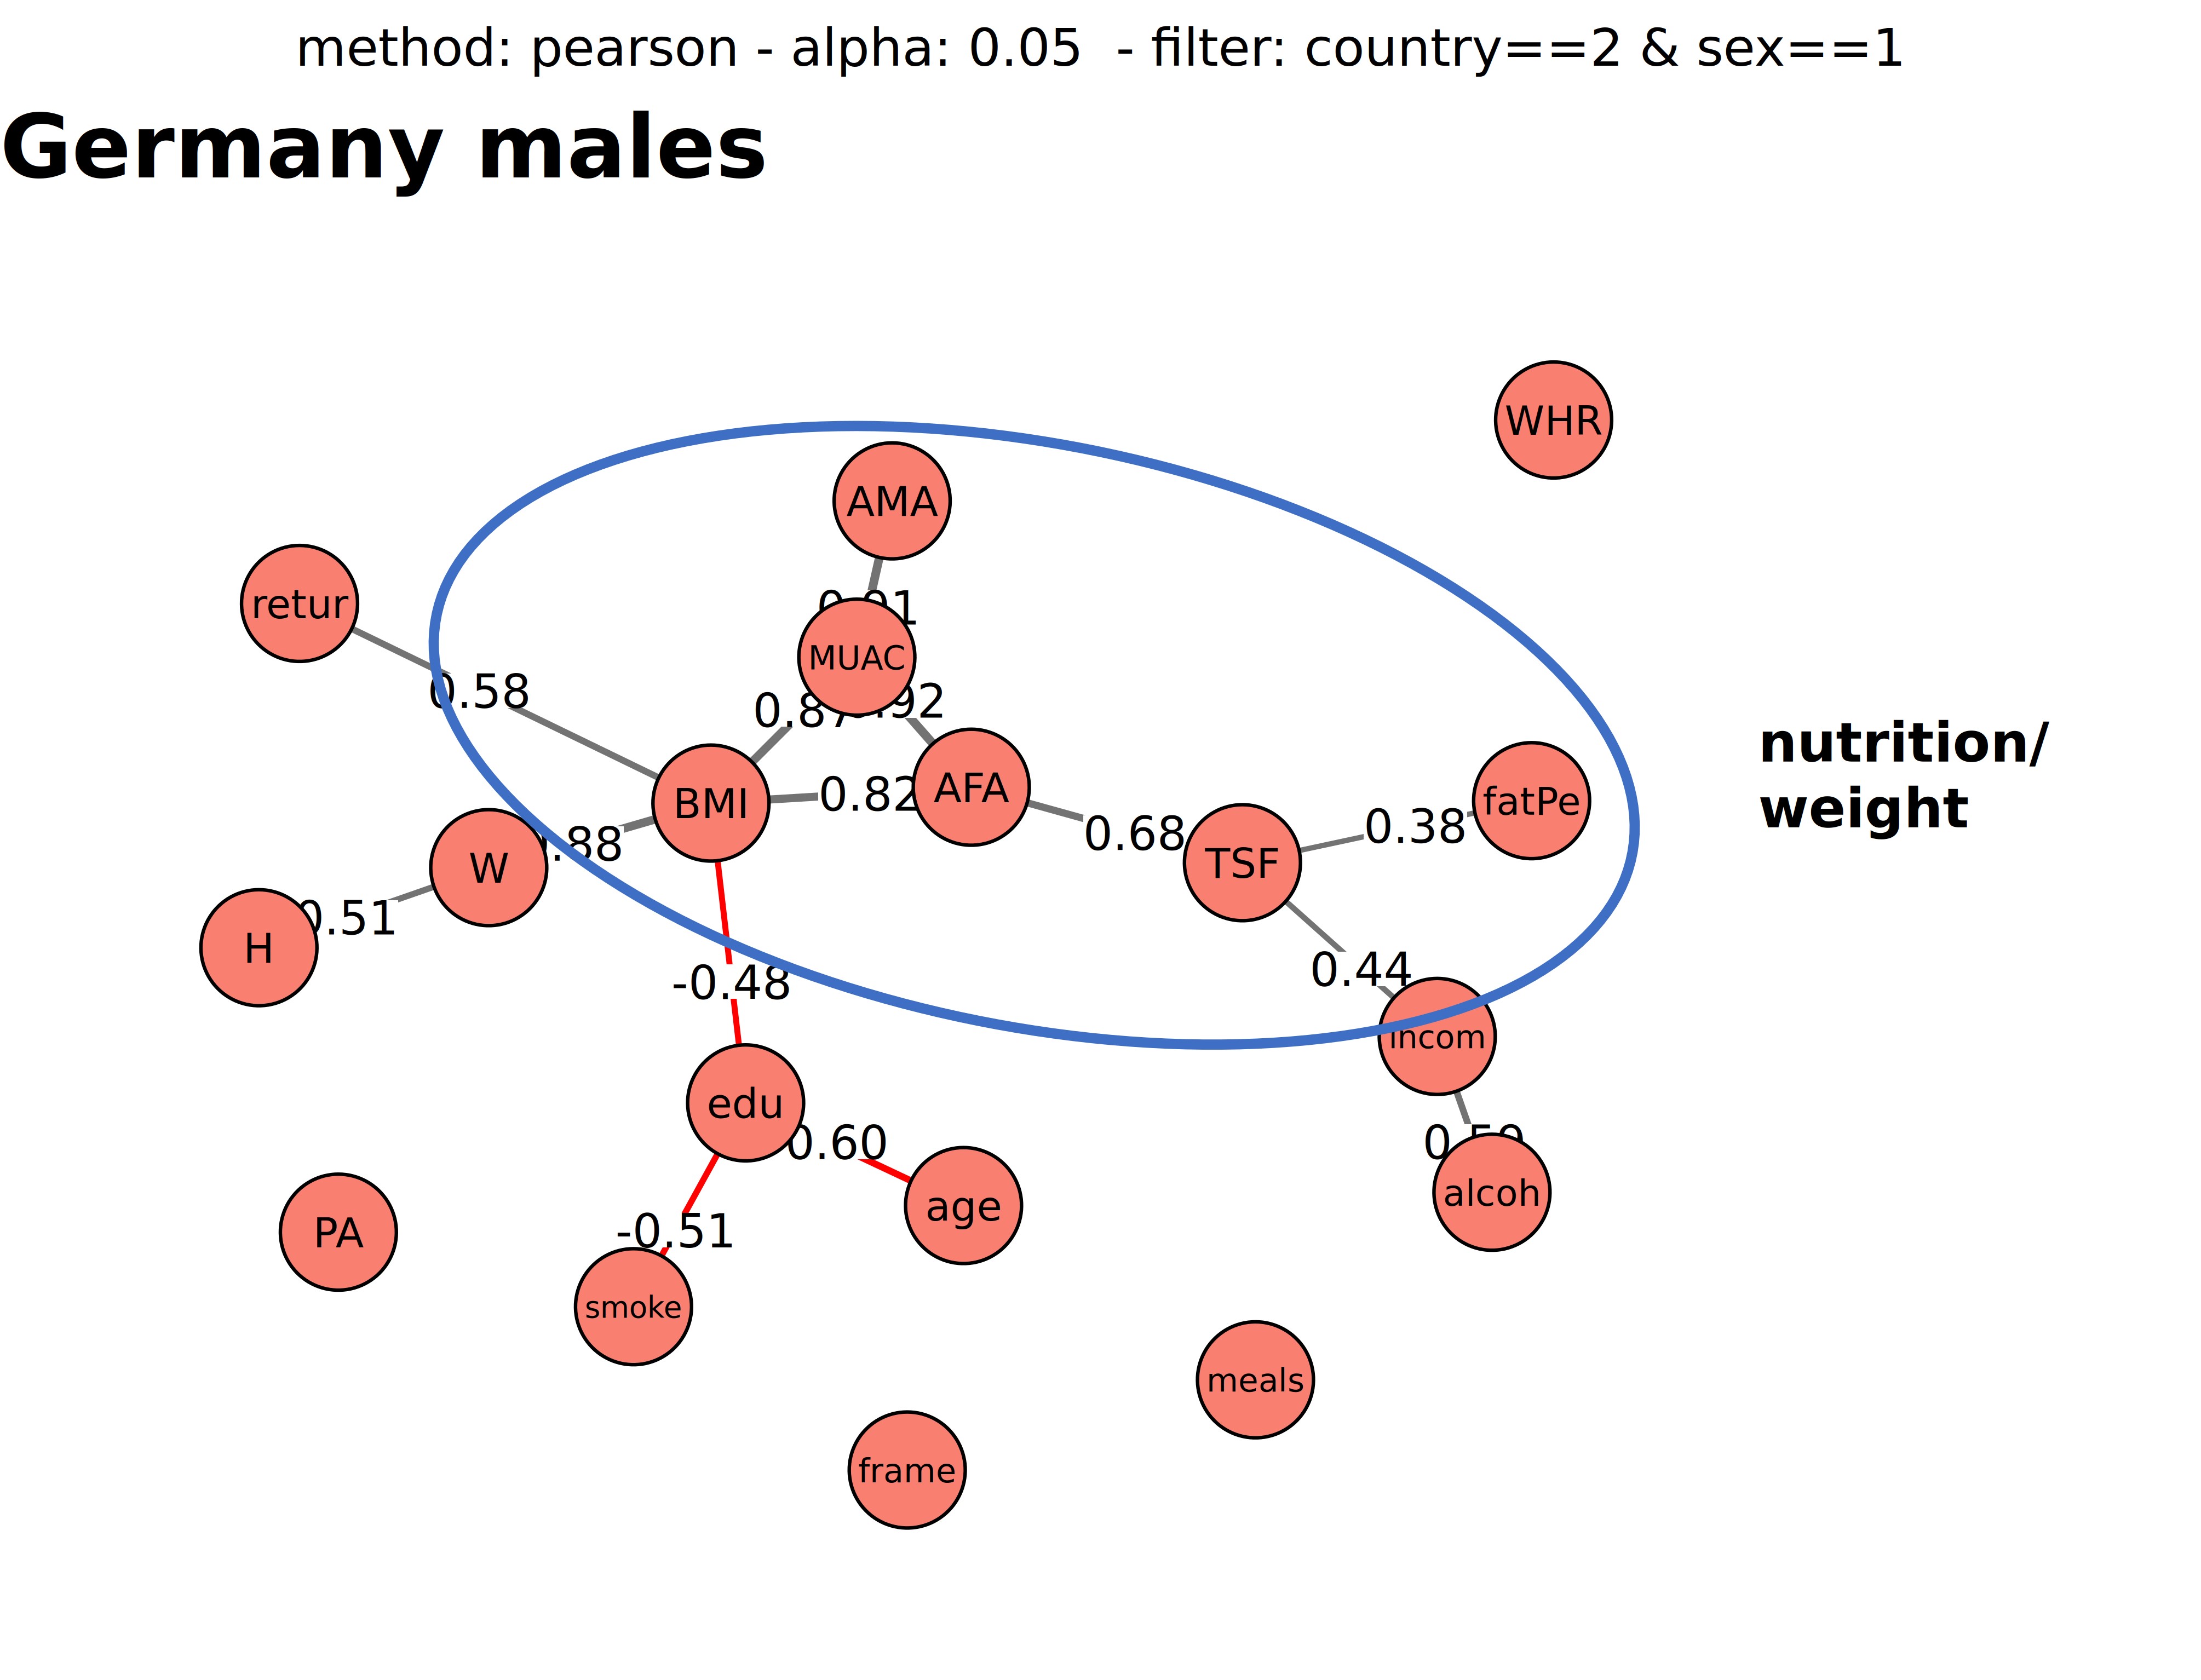
The network displayed the clearest bipartite structure of all six subgroups for males in Türkiye (Figure 3). The nutrition/weight cluster connected to a separate education/income cluster (income–education, r=0.29) via body height, forming the chain: education → height (r=0.42) → weight (r=0.42) → body composition core. This indicates that in resident Turkish males, socioeconomic status and somatic size are integrated through stature — taller, heavier men are also better educated and higher earners. Alcohol was positively linked to income (r=0.21), and education was negatively associated with smoking (r=−0.20), forming a quadruplet of education–income–alcohol–smoking. Physical activity showed a negative association with age (r=−0.27). For males in Germany the nutrition/weight cluster remained coherent (r=0.68–0.92) but the education/income association observed in Türkiye males was absent (Figure 4). Instead, education connected negatively to both age (r=−0.60) and smoking (r=−0.51), and income linked positively to alcohol (r=0.59). Return intention (return) was positively associated with BMI (r=0.58), indicating that German Turkish males who wish to return to Türkiye tend to have higher BMI. FI, WHR, and physical activity were isolated. In Dutch males, WHR occupied a central bridging position between age and the nutrition/weight cluster, connecting to BMI (r=0.58), age (r=0.57), and W (r=0.33), while also showing a negative association with height (r=−0.37) (Figure 5). The education/income sub-cluster was organised through a negative pathway involving return intention: education–return intention (r=−0.46) and return intention–income (r=−0.42), indicating that more poorly educated, lower-earning Dutch Turkish males are more likely to wish to return. Age was negatively associated with education (r=−0.52). Physical activity, smoking, and alcohol were isolated.
Figure 3 SNHA correlation network for Turkish males residing in Türkiye (n=119). Grey edges indicate positive associations; red edges indicate negative associations; edge labels show Pearson r values. The nutrition/weight cluster (large circle: W (weight), BMI, Fat% (fatPe), AFA (arm fat area), AMA (arm muscle area),TSF (triceps skinfold), MUAC (mid upper arm circumference)) connects to the education/income sub-cluster (small circle: Edu (education), Incom (income)) via H (body height), reflecting a socially stratified somatic structure. Education is negatively associated with smoking (smoke) (r=−0.20). Physical activity (PA) is negatively linked to age (r=−0.27). Meals are isolated. Abbreviations: alcoh (alcohol consumption), WHR (waist to hip ratio), frame (frame index).
Figure 4 SNHA correlation network for Turkish males residing in Germany (n=30). The nutrition/weight cluster (TSF (triceps skinfold), AFA (arm fat area), MUAC (mid upper arm circumference), BMI, Fat% (fatPe)) is coherent but the education (edu) /income (incom) association is absent. Education is negatively linked to age (r=−0.60) and smoking (r=−0.51). Income is positively associated with alcohol (alcoh) (r=0.59). Return intention (return) is positively linked to BMI (r=0.58). PA (Physical activity), WHR (waist to hip ratio), and (frame) frame index are isolated. Abbreviations: h (body height), return (return intention to Türkiye), AMA (arm muscle area), w (weight).
Figure 5 SNHA correlation network for Turkish males residing in the Netherlands (n=53). WHR (waist to hip ratio) occupies a central bridging position between age and the nutrition/weight cluster (AMA (arm muscle area), MUAC (mid upper arm circumference), fatPe (%fat), w (weight), TSF (triceps skinfold), AFA (arm fat area)). The education (edu) /income (incom) sub-cluster is organised through a negative pathway via return intention (return): edu–return (r=−0.46) and return–income (r=−0.42), indicating that more poorly educated, lower-earning men are more likely to wish to return. Age is negatively linked to education (r=−0.52). Alcohol (alcoh) and smoking (smoke) are isolated.
Among females in Türkiye, in contrast to males, height was peripheral and negatively associated with frame index (r=−0.51), playing no integrative role in the network (Figure 6). Instead, age served as the network's connective hub, linking the education/income sub-cluster (age–education: r=−0.44), the nutrition/weight cluster (age–BMI: r=0.40), and WHR (age–WHR: r=0.51). The negative age–education edge reflects the generational educational gradient among Turkish females — older are less educated. Age was also negatively associated with alcohol consumption (r=−0.25), consistent with more conservative alcohol norms among older women. For females in Germany, a single large connected network emerged, with the nutrition/weight cluster (r=0.77–0.93) linked through BMI and MUAC to age and FI (Figure 7). Education was strongly negatively associated with age (r=−0.61), and income was positively linked to alcohol (r=0.48). Height was negatively associated with frame index (r=−0.43). Return intention, physical activity, smoking, and meals were all isolated, indicating that these variables did not significantly associate with body composition or sociodemographic factors in this subgroup. The education/income sub-cluster was partially embedded within the broader network via height (Figure 8): income connected to education (r=0.31), height (r=0.38), and alcohol (r=0.34); income was negatively associated with age (r=−0.59) and height negatively with age (r=−0.53), reflecting the pattern that older Dutch Turkish women are shorter and have lower incomes. Education was negatively associated with BMI (r=−0.40), linking the sociodemographic and body composition domains. Physical activity was negatively associated with smoking (r=−0.25).
Figure 6 SNHA correlation network for Turkish females residing in Türkiye (n=159). Age serves as the network hub, connecting the nutrition/weight cluster (AMA (arm muscle area), MUAC (mid upper arm circumference), fatPe (%fat), w (weight), TSF (triceps skinfold), AFA (arm fat area)) to the education (edu)/income (income) sub-cluster (age–edu: r=−0.44) and to WHR (waist to hip ratio) (r=0.51). Height (H) is peripheral and negatively associated with frame index (frame) (r=−0.51). Alcohol (alcoh) is negatively linked to age (r=−0.25). Meals and physical activity (PA) are isolated.
Figure 7 SNHA correlation network for Turkish females residing in Germany (n=45). The nutrition/weight cluster (AFA (arm fat area), TSF (triceps skinfold), MUAC (mid upper arm circumference), BMI, W (weight), fatPe (Fat%), AMA (arm muscle area)) is the dominant structure. Education (edu) is strongly negatively associated with age (r=−0.61). Income (incom) is positively linked to alcohol (alcoh) (r=0.48). Height (H) is negatively associated with frame index (frame) (r=−0.43). Return intention (retur), smoking (smoke), meals, and physical activity (PA) are isolated.
Figure 8 SNHA correlation network for Turkish females residing in the Netherlands (n=72). The education/income sub-cluster (edu, income) is partially embedded in the broader network via H (body height) and BMI. Income is negatively associated with age (r=−0.59) and positively with alcohol (alcoh) (r=0.34). Education is negatively linked to BMI (r=−0.40). Physical activity (PA) is negatively associated with smoking (r=−0.25). Return intention (retur) and meals are isolated. Abbreviations: AMA (arm muscle area), MUAC (mid upper arm circumference), fatPe (%fat), w (weight), TSF (triceps skinfold), AFA (arm fat area), frame (frame index).
Discussion
Interpreting Body Composition Differences Through Integration Regimes
This study examined how body composition varies among Turkish adults across three national contexts — Türkiye (country of origin), Germany, and the Netherlands — that also differ in their institutional approaches to migrant integration. A striking sex-specific pattern emerged consistently across all analytical approaches. In males, age adjustment eliminated virtually all country differences in body composition, indicating that observed cross-country variation is largely explained by age structure rather than by migration-related somatic adaptation. In females, however, substantial country differences persisted after age adjustment — particularly in AMA, AFA, MUAC, and frame index — demonstrating residual contextual effects beyond age. Because country of residence is a composite of many unmeasured environmental and social characteristics — including healthcare systems, occupational structure, dietary habits, and migration history, in addition to integration policy — these residual differences suggest that some feature or features of the host-country context, of which integration policy is one plausible candidate, shape female migrants' body composition through mechanisms that extend beyond age-related metabolic changes. Given the cross-sectional design, this interpretation should be regarded as hypothesis-generating rather than a demonstration of a causal mechanism.
Multiple linear regression across the full sample (Table 4) confirmed that both Germany (β=0.061, p=0.014) and the Netherlands (β=0.073, p=0.005) were independently associated with elevated AFA relative to Türkiye after controlling for BMI, BF%, FFM, age, and sex. Hierarchical regression in females (Table 5) demonstrated that country of residence contributed a statistically significant, though modest, independent increment to AFA variance (ΔR²=0.025, p=0.017) even after sequentially controlling for age, education, income, and behavioural factors. This indicates that some aspect of the country-level environment — of which integration policy is one candidate among several unmeasured possibilities — is associated with female fat reserves beyond individual-level pathways, though the magnitude of this increment calls for a restrained interpretation. For AMA, the block-level increment did not reach conventional significance (ΔR²=0.015, p=0.072), indicating that the country block as a whole did not significantly improve model fit for muscle area. PCR (Table 6) offered a complementary, though not independent, line of evidence. Three latent dimensions were identified: a general adiposity component (PC1; 37.6% of variance), a sex and lean mass component (PC2; 26.4%), and a component reflecting country of residence (PC3; 12.0%), characterised by opposing loadings for Germany (−0.61) and the Netherlands (+0.66). We label PC3 a "country/integration policy" dimension for interpretive convenience, but statistically it captures variation associated with country of residence broadly, not integration policy specifically. PC3 was a significant independent predictor of both AMA (p<0.001) and AFA (p<0.001), indicating that between-country variation constitutes a distinct dimension of body composition variation beyond adiposity and sex effects; whether integration policy is the operative mechanism behind this dimension cannot be established from these cross-sectional, country-level data alone.
Sex-Specific Patterns: Males versus Females
The pronounced sex difference in age-adjustment effects provides crucial insights into how migration contexts shape body composition differently in males and females. In males, age confounding accounts for essentially all observed cross-country differences. Turkish male migrants in Germany and in the Netherlands do not exhibit distinct anthropometric profiles relative to males remaining in Türkiye once age is controlled, suggesting that the observed differences reflect age structure rather than metabolic adaptation to migration (Arends-Tóth and van de Vijver 2002). This finding implies that male migrants' body composition is fundamentally shaped by age at measurement, with limited additional restructuring linked to host-country integration regimes.
In females, the pattern was substantially more complex. While age accounted for approximately 88% of BMI variation across countries (η² reducing from 0.113 to 0.014), indicating that overall adiposity differences are primarily age-mediated, substantial country effects persisted for lean mass and skeletal measures. The persistence of significant differences in AMA, AFA, MUAC, and frame index after age adjustment (all p<0.01) reveals that integration regime characteristics influence how female migrants allocate body tissue and develop skeletal dimensions beyond what age-related metabolic changes alone would predict (Hermanussen and Scheffler 2016). Notably, education emerged as a strong independent negative predictor of both AMA (β=−0.288, p<0.001) and AFA (β=−0.199, p=0.012) in the hierarchical models, suggesting that educational attainment — which differed substantially across countries, with Türkiye showing the highest rates — operates as a protective sociodemographic pathway moderating the relationship between integration context and body composition.
Integration Policy Regimes and Structural Inequality
One candidate explanation for the persisting female country differences is the contrasting integration regime of Germany and the Netherlands, though we emphasise that this explanation is inferred from the broader migration literature rather than directly tested in the present data. The Netherlands have historically favoured multicultural policies that support retention of ethnic community structures, whereas Germany has favoured integration-oriented policies that encourage closer engagement with host-society institutions (Arends-Tóth and van de Vijver 2002; Ersanilli and Koopmans 2010). These contrasting models have been linked, in prior work, to differences in ethnic educational inequality and social mobility between the two countries (Crul and Schneider 2009; Kymlicka 2007; Tolsma et al. 2007). If such structural differences also extend to differential access to occupational, health-service, and everyday behavioural resources, they could plausibly contribute to the country differences in AMA and AFA observed here. However, our data cannot confirm this pathway, and other unmeasured features of country context — including healthcare systems, dietary environments, labour-market structure, and general migration history — may contribute as much or more than integration policy specifically.
In contrast, Germany has historically struggled with its role as an immigrant-receiving country but has favoured stronger efforts toward integrating migrants into the host society, emphasizing adaptation to dominant cultural norms and institutions (Eckardt 2007; Ersanilli and Koopmans 2010). Although migrants in Germany continue to maintain cultural traditions and transnational ties to their countries of origin (Waldinger 2018; Mouw et al. 2014), integration-oriented policies appear to promote closer engagement with host-community educational, occupational, and social structures. At the same time, these policies may limit the extent to which ethnic cultural practices function as compensatory resources for disadvantaged social status (Diehl and Schnell 2006). These contrasting institutional frameworks thus generate differential occupational opportunities, health service accessibility, and everyday behavioural contexts that ultimately shape body composition through biocultural pathways.
Body Composition Structure as a Marker of Social Integration
Turkish female migrants in Germany, despite being younger on average than their Dutch counterparts in our study, exhibited significantly greater adjusted AMA and distinct AFA patterns. The frame index demonstrated the strongest country effect, with a clear gradient from Türkiye (38.32) through Germany (38.77) to the Netherlands (39.75), suggesting that skeletal robustness — a marker of developmental stress and cumulative activity patterns — differs systematically across integration regime contexts (Scheffler and Hermanussen 2014; Mumm et al. 2021). The arm muscle area reflects accumulated protein reserves and muscular development influenced by occupational demands and lifestyle patterns (Hermanussen 2013), and the higher adjusted AMA among female migrants relative to non-migrant females in Türkiye suggests that migration contexts — particularly integration-oriented Germany — may provide structural or occupational conditions that support greater lean tissue development.
This distinction between overall adiposity (primarily age-mediated) and body composition structure (country-specific) has important theoretical implications. Integration regimes do not simply increase total fat accumulation in female migrants; rather, they appear to fundamentally reorganise how female bodies allocate tissue and develop structurally. This restructuring may reflect genuine adaptation to new occupational and social environments, but may also indicate cumulative physiological stress associated with differential integration success. Socioeconomic, political, and emotional (SEPE) factors fundamentally regulate human growth and body composition across the life course (Bogin 2020), operating through the structural constraints and opportunities that integration regimes create.
SNHA Network Patterns: Socio-somatic Integration Across Integration Contexts
The SNHA networks reveal that the coherence of the nutrition/weight cluster — comprising BMI, weight, fat percentage, AFA, TSF, and MUAC — is a universal feature across all six subgroups, regardless of sex or country of residence. This structural robustness confirms that these anthropometric variables measure a single underlying somatic dimension and supports their use as a coherent analytical unit in this study. However, the peripheral organisation of the networks — how this adiposity core connects to sociodemographic and behavioural variables — differed systematically across integration contexts, extending the regression and PCR findings with structural evidence.
The most striking contrast concerns the role of body height. In Türkiye males, height served as the critical bridge between the education/income cluster and the body composition core, reflecting a socially stratified somatic structure in which taller, heavier men also tend to be better educated and higher earners. This pattern is consistent with the well-documented relationship between social status and stature in structured societies (Hermanussen and Scheffler 2016; Scheffler and Hermanussen 2025), and suggests that in the resident Turkish population, socioeconomic hierarchy is biologically embodied through stature. This integrative role of height was entirely absent in all migrant subgroups and in Türkiye females, indicating that height-mediated socio-somatic integration is specific to socially embedded, non-migrant males in a more settled societal structure.
In Türkiye females, age replaced height as the network hub. The negative age–education edge (r=−0.44) reflects the well-documented generational educational gradient in Türkiye, where older women received considerably less formal education than younger cohorts (Hacettepe University Institute of Population Studies 2014). The positive age–WHR association and the negative age–alcohol link is consistent with age-related body redistribution patterns and more conservative social norms regarding alcohol consumption among older females. Crucially, WHR did not associate with the general adiposity cluster in this or any other group — instead connecting consistently to age — suggesting that WHR captures age-related body shape change rather than general nutritional status, a distinction that has methodological implications for its use as an adiposity indicator in this population.
The absence of the education–income association in German males, and its transformation into a negative education–age and income–alcohol pathway, points to a structural decoupling of socioeconomic domains in the integration-oriented German context. The positive link between return intention and BMI in German Turkish males is particularly notable: those who wish to return to Türkiye tend to have higher body mass, possibly reflecting social and psychological disengagement from the integration process, reduced engagement with health-promoting behaviours in the host society, or both. This finding adds a behavioural dimension to the regression result that country of residence independently predicts body composition.
The Dutch male network revealed a distinctive pattern in which the education/income cluster was organised through a negative pathway via return intention (education → return → income, all negative). This suggests that in the multicultural Dutch context, poorly educated, lower-income men are more likely to express a desire to return, forming a cluster of disadvantages that is structurally separate from body composition. In the Turkish migrant females living in the Netherlands, however, the education/income dyad was partially integrated into the broader network via H and BMI, providing multivariate structural support for the regression finding that education was a strong negative predictor of AFA and AMA in the female hierarchical model.
The consistent isolation of meals and physical activity across all six networks is noteworthy. It suggests that at the population level, meal frequency and leisure-time physical activity as measured in this study do not co-vary significantly with body composition or sociodemographic factors within any subgroup. This does not exclude their importance at the individual level, but indicates that they do not contribute meaningfully to the structural organisation of body composition variation captured by SNHA.
Finally, the income–alcohol association was identified in four of the six subgroups (Türkiye: males, Germany: males, Germany: females, the Netherlands: females), extending in several cases to include education and smoking. This pattern is consistent with observations that higher-income individuals in many societies consume alcohol more frequently (Gadd et al. 2005) and suggests that economic integration into host-country social structures may carry behavioural consequences that extend beyond dietary patterns to substance use.
Sex Differences in Integration Effects
Why do Turkish female migrants show genuine body composition restructuring while males do not? Several biocultural explanations merit consideration. First, females may experience more pronounced occupational transitions upon migration: female labour force participation in Türkiye is substantially lower than in Germany or the Netherlands, suggesting that migration exposes women to fundamentally different occupational demands and physical activity contexts (Hermanussen et al. 2021). Males, having more commonly participated in the workforce in Türkiye, may experience less dramatic shifts in occupational structure upon migration.
Second, differential reproductive health contexts may shape female body composition across countries. Women encounter reproductive health services — including contraceptive use, pregnancy, and menopause management — that differ substantially across national contexts. These life course events have profound effects on body composition, and integration regimes may differentially influence women's access to reproductive health information and services (Delavari et al. 2013). Third, gendered migration experiences may create differential psychosocial stress, with females potentially experiencing greater social disruption and more pronounced impacts of integration success or failure on metabolic outcomes (Ersanilli and Koopmans 2009). Finally, the timing of migration relative to critical developmental windows — which the present study could not assess — may differ by sex, with adolescent migration potentially producing different somatic trajectories than adult migration.
Implications for Public Health and Policy
The findings suggest that country of residence — plausibly reflecting integration policy regimes among other unmeasured contextual factors — has measurable and independent associations with migrant body composition, particularly among females. If integration policy indeed contributes to this pattern, as our data are consistent with but cannot prove, public health interventions addressing body composition disparities in migrant populations may benefit from considering how integration policies shape occupational opportunities, health service accessibility, and psychosocial stress. Culturally tailored interventions developed with migrant communities — such as mosque-centered health promotion and community-based nutrition education — should address not only individual behaviours but also the structural contexts in which those behaviours occur (Eckardt 2007). Gender-responsive approaches recognising differential integration experiences and occupational transitions for males and females would strengthen intervention effectiveness (Ersanilli and Koopmans 2010; Mouw et al. 2014).
At the policy level, the contrast between the Netherlands' multicultural approach and Germany's integration-oriented approach illustrates that both models entail distinct health trade-offs for female migrants. Countries committed to reducing health disparities in migrant populations should consider whether current integration policies create equitable opportunities for occupational and educational advancement, health service accessibility, and social participation. The independent contribution of country of residence to body composition — confirmed across multiple analytical approaches — underscores that health outcomes in migrant populations are not reducible to individual risk factors but are partly constituted by macro-social policy contexts.
Limitations
Although the study included adults across a relatively wide age range (18–65 years), age was statistically controlled in all multivariable analyses. Nevertheless, residual age-related physiological changes cannot be completely excluded, particularly those associated with later adulthood.
A more fundamental limitation concerns the interpretation of country of residence itself. Throughout this study, country of residence is used as a proxy for integration policy context; however, statistically the analyses concern country of residence, which is inevitably a composite of many environmental and social characteristics — including healthcare systems, occupational structure, dietary habits, migration history, and numerous other factors that were not examined here. Integration policy should therefore be regarded as one plausible contributor to the observed country differences rather than as the demonstrated mechanism underlying them. Relatedly, because this is a cross-sectional study, language used elsewhere in this manuscript to describe associations between country context and body composition should be read as describing statistical association rather than established causation; longitudinal or intervention-based designs would be required to establish causal pathways.
Several potentially relevant confounders were not measured and could not be incorporated into the statistical models. These include occupational change following migration, reproductive health factors (including menopausal status and parity), psychosocial stress, and age at migration, duration of residence, and migrant generation. Any of these unmeasured factors could plausibly contribute to the country and sex differences reported here, and their absence limits our ability to adjudicate between integration policy and the other candidate explanations discussed above. In addition, although age was entered as a covariate in all multivariable models, the female groups differed substantially in mean age across countries; residual age-related influences beyond what a linear covariate can capture cannot be fully excluded.
Finally, some of the statistical evidence for a distinct country effect, while consistent across analyses, was modest in magnitude — for example, the additional variance explained by country of residence in the hierarchical regression for AFA, while statistically significant, was relatively small (ΔR²=0.025). Similarly, the third principal component in the PCR analysis is defined statistically by loadings on country of residence and is labelled a "country/integration policy" dimension only by inference; it does not directly measure integration policy itself. These considerations call for a measured interpretation of the country effects reported in this study.
Conclusion
This study provides convergent evidence — from ANCOVA, multiple regression, hierarchical regression, principal component regression, and St. Nicolas House Analysis — that the country of residence is independently associated with body composition in female Turkish migrants, over and above individual-level factors. In females, the country of residence contributed a significant, though modest, independent increment to AFA variance, and PCR identified a country-of-residence dimension as a structurally distinct predictor of both AMA and AFA. In males, age structure fully accounted for cross-country variation. SNHA networks further demonstrated that the country context does not merely shift mean body composition values but reorganises the multivariate structure of associations among somatic, sociodemographic, and behavioural variables — most strikingly, the integrative role of height in the settled Türkiye male network was entirely absent in migrant subgroups, where sociodemographic variables decoupled from body composition or organised around negative pathways and return intention. Because country of residence is a composite of many unmeasured factors, integration policy is best regarded as one plausible contributor to these patterns rather than as the demonstrated mechanism.
These findings underscore that the macro-social country context — of which integration policy is a plausible, though not directly measured, component — carries measurable biocultural consequences for female somatic profiles. Moving beyond BMI to multidimensional body composition assessment, and beyond individual risk factors to the macro-social context, is essential for addressing health disparities in migrant populations. Sex-responsive, structurally informed public health interventions are needed to target the determinants of body composition inequality across host-country contexts, with future research required to isolate the specific contribution of integration policy.
Ethical approval
Ethical approval for this study was obtained from the Ethics Committee of Ankara University (Meeting No.171-Decision No.1227; 2024).
Use of Artificial Intelligence
The authors used deepl.com for grammar and language checking. The authors confirm that they have reviewed and verified the content generated by deepl.com for accuracy and integrity.
Funding statement
This research received no specific grant from any funding agency in the public, commercial, or not-for-profit sectors.
Acknowledgements
The authors are grateful to all participants for their valuable time, cooperation, and contribution to this study. We also thank the institutions, community organizations, and local leaders who supported the recruitment process and facilitated data collection.
References
Arends-Tóth, J./van de Vijver, F. J. R. (2002). Multiculturalism and acculturation: Views of Dutch and Turkish-Dutch. European Journal of Social Psychology 33 (2), 249–266. https://doi.org/10.1002/ejsp.143.
Baran, K./Özer, B. K./Hermanussen, M./Groth, D./Scheffler, C. (2024). Transcending borders: Anthropometric insights and body image among Turkish immigrants in Germany and the Netherlands. Human Biology and Public Health 2. https://doi.org/10.52905/hbph2024.2.87.
Bogin, B. (2020). Patterns of Human Growth. 3rd ed. Cambridge, Cambridge University Press.
Crul, M./Schneider, J. (2009). Children of Turkish immigrants in Germany and the Netherlands: The impact of differences in vocational and academic tracking systems. Teachers College Record 111 (6), 1508–1527. https://doi.org/10.1177/016146810911100602.
Delavari, M./Søgaard Tøttenborg, S./Karim, K./Bani Khademi, Z. (2013). Prevalence of obesity among migrant populations: A systematic review. Public Health Nutrition 16 (3), 451–456. https://doi.org/10.1017/S1368980012002765.
Diehl, C./Schnell, R. (2006). “Reactive ethnicity” or “assimilation”? Statements, arguments, and first empirical evidence for labor migrants in Germany. International Migration Review 40 (4), 786–816. https://doi.org/10.1111/j.1747-7379.2006.00044.x.
Dijkshoorn, H./Nierkens, V./Nicolaou, M. (2008). Risk groups for overweight and obesity among Turkish and Moroccan migrants in The Netherlands. Public Health 122 (6), 625–630. https://doi.org/10.1016/j.puhe.2007.08.016.
Ersanilli, E./Koopmans, R. (2009). Ethnic retention and host culture adoption among Turkish immigrants in Germany, France and the Netherlands: A controlled comparison. Wissenschaftszentrum Berlin für Sozialforschung. Berlin. SP IV 2009-701. Available online at https://www.ssoar.info/ssoar/handle/document/19725.
Ersanilli, E./Koopmans, R. (2010). Rewarding integration? Citizenship regulations and the socio-cultural integration of immigrants in the Netherlands, France, and Germany. Journal of Ethnic and Migration Studies 36 (5), 773–791. https://doi.org/10.1080/13691831003764318.
Frisancho, A. R. (1981). New norms of upper limb fat and muscle areas for assessment of nutritional status. The American Journal of Clinical Nutrition 34 (11), 2540–2545. https://doi.org/10.1093/ajcn/34.11.2540.
Frisancho, A. R. (1984). New standards of weight and body composition by frame size and height for assessment of nutritional status of adults and the elderly. The American Journal of Clinical Nutrition 40 (4), 808–819. https://doi.org/10.1093/ajcn/40.4.808.
Frisancho, A. R. (1990). Anthropometric Standards for the Assessment of Growth and Nutritional Status. Ann Arbor, University of Michigan Press.
Gadd, M./Sundquist, J./Johansson, S.-E./Wändell, P. (2005). Do immigrants have an increased prevalence of unhealthy behaviours and risk factors for coronary heart disease? European Journal of Cardiovascular Prevention and Rehabilitation 12 (6), 535–541. https://doi.org/10.1097/01.hjr.0000174829.25388.ed.
Hacettepe University Institute of Population Studies (2014). Turkey Demographic and Health Survey 2013. Ankara, Hacettepe Üniversitesi Nüfus Etütleri Enstitüsü.
Hermanussen, M. (Ed.) (2013). Auxology. Studying human growth and development : 89 tables. Stuttgart, Schweizerbart Science Publ.
Hermanussen, M./Aßmann, C./Groth, D. (2021). Chain reversion for detecting associations in interacting variables - St. Nicholas House Analysis. International Journal of Environmental Research and Public Health 18 (4), 1741. https://doi.org/10.3390/ijerph18041741.
Hermanussen, M./Scheffler, C. (2016). Stature signals status: The association of stature, status and perceived dominance - a thought experiment. Anthropologischer Anzeiger 73 (4), 265–274. https://doi.org/10.1127/anthranz/2016/0698.
Heymsfield, S. B./McManus, C./Smith, J./Stevens, V./Nixon, D. W. (1982). Anthropometric measurement of muscle mass: revised equations for calculating bone-free arm muscle area. The American Journal of Clinical Nutrition 36 (4), 680–690. https://doi.org/10.1093/ajcn/36.4.680.
Koca, C./Lapa, T. Y. (2014). Analysis of physical activity and acculturation among Turkish migrants in Germany and England. Perceptual and Motor Skills 119 (3), 698–716. https://doi.org/10.2466/06.PMS.119c29z7.
Kymlicka, W. (2007). Multicultural Odysseys: Navigating the New International Politics of Diversity. Navigating the new international politics of diversity. Oxford, Oxford University Press.
Mouw, T./Chavez, S./Edelblute, H./Verdery, A. (2014). Bi-national social networks and assimilation: A test of the importance of transnationalism. Social Problems 61 (3), 329–359. https://doi.org/10.1525/sp.2014.12192.
Mumm, R./Reimann, A./Scheffler, C. (2021). Estimation of percentage of body fat in field studies ‐ a method based on relative elbow breadth (Frame Index) and BMI. Human Biology and Public Health 1. https://doi.org/10.52905/hbph.v1.3.
Roche, A. F./Heymsfield, S. B./Lohman, T. G. (Eds.) (1996). Human Body Composition. Champaign, Human Kinetics.
Scheffler, C./Hermanussen, M. (2014). Is there an influence of modern life style on skeletal build? American Journal of Human Biology 26 (5), 590–597. https://doi.org/10.1002/ajhb.22561.
Scheffler, C./Hermanussen, M. (2025). Human growth regulation is dominated by the socio-cultural exposome. Human Biology and Public Health 2. https://doi.org/10.52905/hbph2025.2.119.
Tolsma, J./Coenders, M./Lubbers, M. (2007). Trends in ethnic educational inequalities in the Netherlands: A cohort design. European Sociological Review 23 (3), 325–339. https://doi.org/10.1093/esr/jcm007.
Ujcic-Voortman, J. K./Baan, C. A./Seidell, J. C./Verhoeff, A. P. (2011). Obesity and cardiovascular disease risk among Turkish and Moroccan migrant groups in Europe: A systematic review. Obesity Reviews 13 (1), 2–16. https://doi.org/10.1111/j.1467-789X.2011.00932.x.
Ulijaszek, S. J. (1995). Human Energetics in Biological Anthropology. Cambridge, Cambridge University Press.
 ✉