Childhood growth, current age, and waist circumference predict biological
reserve capacity, physical performance, and rapid aging in Bangladeshi
women
Barry Bogin ✉
✉
UCSD/Salk Center for Academic Research and Training in Anthropogeny (CARTA),
La Jolla, California, USA, https://carta.anthropogeny.org/users/barry-bogin;
Professor Emeritus of Biological Anthropology, School of Sport, Exercise & Health
Sciences, Loughborough University, Loughborough LE11 3TU, United Kingdom, 209.
DOI: https://doi.org/10.52905/hbph2022.3.51
Abstract
BackgroundThe UK Bangladeshi community is socially disadvantaged, and many adults suffer from
obesity, diabetes, and other chronic illnesses. Rapid aging has been noted.
ObjectivesAnalyse biosocial trade-offs in growth, adult body composition, and reproduction, which
are risk factors for age-related decline in physical performance, more rapid aging,
frailty, and death.
MethodsSample: 40 Bangladeshi mothers (40-70 years old), one of their adult daughters (N=37,
18-36 years old) in the United Kingdom (UK), and 22 mother-daughter pairs of the same
age range in Bangladesh (BD). Measurements: anthropometry, including knee height,
migration, demographic history, education level, current menstruation (yes/no), and a
7-component lower body physical function score (PFS). Analysis: ridge regression and St
Nikolas House Analysis (SNHA).
ResultsAll the women are of short stature (x̄=150cm), with especially low knee height.
Daughters who migrated to the UK have shorter knee height than daughters born in the UK.
Marriage age was 16-18 years and total pregnancies of ~6 per mother, ~3 per daughter. UK
mothers have higher fatness and lower PFS than BD women. Greater knee height predicts
greater PFS, and that greater waist circumference and older age predict a lower PFS.
SNHA finds that knee height is the most direct predictor of PFS.
ConclusionAdult knee height may serve as a sensitive indicator of early life physical and
emotional well-being and predict physical performance, a risk factor for frailty and
death. International migration of daughters is associated with poorer health status and
physical performance at later ages.
Keywords: child growth, migration, social isolation, reserve capacity, lower body performance
Conflicts of interest: There are
no conflicts of interest.
Citation: Bogin, B. (2022). Childhood growth, current age, and waist circumference predict biological
reserve capacity, physical performance, and rapid aging in Bangladeshi
women. Human Biology and Public Health 3. https://doi.org/10.52905/hbph2022.3.51.
Copyright: This is an open access article distributed under the terms of the Creative Commons Attribution License which permits unrestricted use, distribution, and reproduction in any medium, provided the original author and source are credited.
Received: 03-10-2022 | Accepted: 07-11-2022 | Published: 13-03-2023
Take-home message for students
1. International migration from Bangladesh to the United Kingdom is associated with
social isolation, poorer health, lower physical performance, and greater risk for
frailty.
2. Protecting and enhancing early life health may save national health systems
considerable expense and may enrich the personal lives of older people and their
families.
Contents
Introduction
The primary aim of this article is to investigate the effects of early life physical and
emotional health, reproductive history (age at marriage, pregnancies, birth), and later life
body composition (muscularity and fatness) on physical performance. We focus on a group of
Bangladeshi women, 40 to 70 years old, and one of their adult daughters living in Bangladesh
or in the United Kingdom. The findings of the present analysis are for these specific women
and for their histories of birthplace, upbringing, migration (or not), age at marriage, age
at first birth, subsequent births, and their body measurements at the time of testing their
physical performance. However, many of the findings should apply to all women. This is so
because the variables considered are common to virtually all human groups. The findings are
important because many migrant women from lower income nations experienced much physical,
material, social, economic, political, and emotional adversity in the lives. These
adversities increase the likelihood of poor physical performance at an earlier age, relative
to more advantaged groups of women. Poor physical performance is a reliable proxy for
current health and a reliable predictor for the onset of frailty and mortality (Guralnik et al. 1994; Guralnik et al. 2000; Ferrucci et al.
2002). As stated by one of the leading research groups, “The assessment of physical
functioning and disability is a critical component in the evaluation of older persons in
both clinical and research settings” (Guralnik et al.
1994).
Specifically, we test two hypotheses, 1) greater knee height predicts higher levels of
physical performance at later ages, and 2) the strength of this prediction is moderated by
age at marriage and first reproduction, with earlier marriage and first birth leading to
lower levels of physical performance at later ages.
There are several scientific and pedagogical strengths of this article. First is the use of
life history theory to examine trade-offs between early life growth, reproduction, adult
body composition, and physical performance. Second, the methods include the use of knee
height, measured in adults, as a biomarker for physical and emotional health and well-being
during the first decade of post-natal life. Associations are explored between the growth of
knee height and quality of life factors, such as international migration from Bangladesh to
the United Kingdom, reproductive history, including age at first reproduction and total
number of pregnancies, and the rate of aging for a group of older mothers and their adult
daughters. Third, the international context of Bangladeshi migration adds social, economic,
political, and cultural dimensions to our analyses that are shared with many other
populations around the globe. Fourth, the theoretical approaches to data analysis and
interpretation include biological reserve capacity and a life course model of growth,
maturation, and health. Together, the theory, methods, analyses, and findings contribute to
the improvement of knowledge regarding several factors and process of health, well-being,
and aging from birth to later adulthood.
Theoretical framework
Four intersecting frameworks guide this research: 1) Life history theory; 2) a life course
model of growth and maturation; 3) biological reserve capacity; and 4) knee height as a
proxy for early life material and emotional condition for growth.
1. Life history theory is a field of biology concerned with the strategy an organism uses
to allocate its energy toward growth, body maintenance, defence against infection,
reproduction, raising offspring to independence, and avoiding death (Bogin and Smith 2012; Varea and
Bernis 2013). For a mammal, it is the strategy of when to be born, when to be
weaned, how many and what type of pre-reproductive stages of development to pass through,
when to reproduce, and when to die. Living things on earth have greatly different life
history strategies and understanding what shapes these histories is one of the most active
areas of research in whole-organism biology. The life history approach attempts to unravel
the reasons why different species of animals follow different sequences of growth,
development, and maturation and why new life stages evolve, such as the childhood and
adolescence stages of humans (Bogin 2021a). The
nature of biological growth, development, and maturation is often best understood in terms
of life history strategies for efficient self-health, reproduction and offspring survival
(Cole 1954; Stearns 2004). A synopsis of human post-natal life history stages of growth,
development, and maturation is given in Text Box 1.
Text Box 1: Human post-natal life history stages
As explained in the main text, the present research focuses on the ‘Early years’ of the
developmental pathway (the large arrow in Figure
1). Shown below the large arrow is an ‘enlargement’ of these ‘Early years’ divided
into several stages of biological life history – infancy, childhood, juvenile, and
adolescent. Detailed definitions of these life history stages may be found elsewhere
(Bogin et al. 2018; Bogin 2021a). Briefly, these stages may be defined in terms of height
growth velocity and in terms of feeding behaviour. A neonatal period from birth to about
28 days encompasses the transition from prenatal to postnatal life. Then begins the
infancy stage, which continues to age 30–36 months and is characterized by feeding via
lactation, with complimentary foods added by the end of the first year. The transition to
childhood is characterized by the termination of maternal lactation and the completion of
deciduous tooth eruption by the infant. The limitations of a deciduous dentition and small
digestive system require that children eat easy to chew and nutrient dense foods. Older
members of the social group acquire, prepare, and provision these foods to children. This
style of cooperative care frees the child’s mother from lactation and much care and
feeding of the child. The mother may then devote her resources to a new pregnancy and
lactation of a new infant.
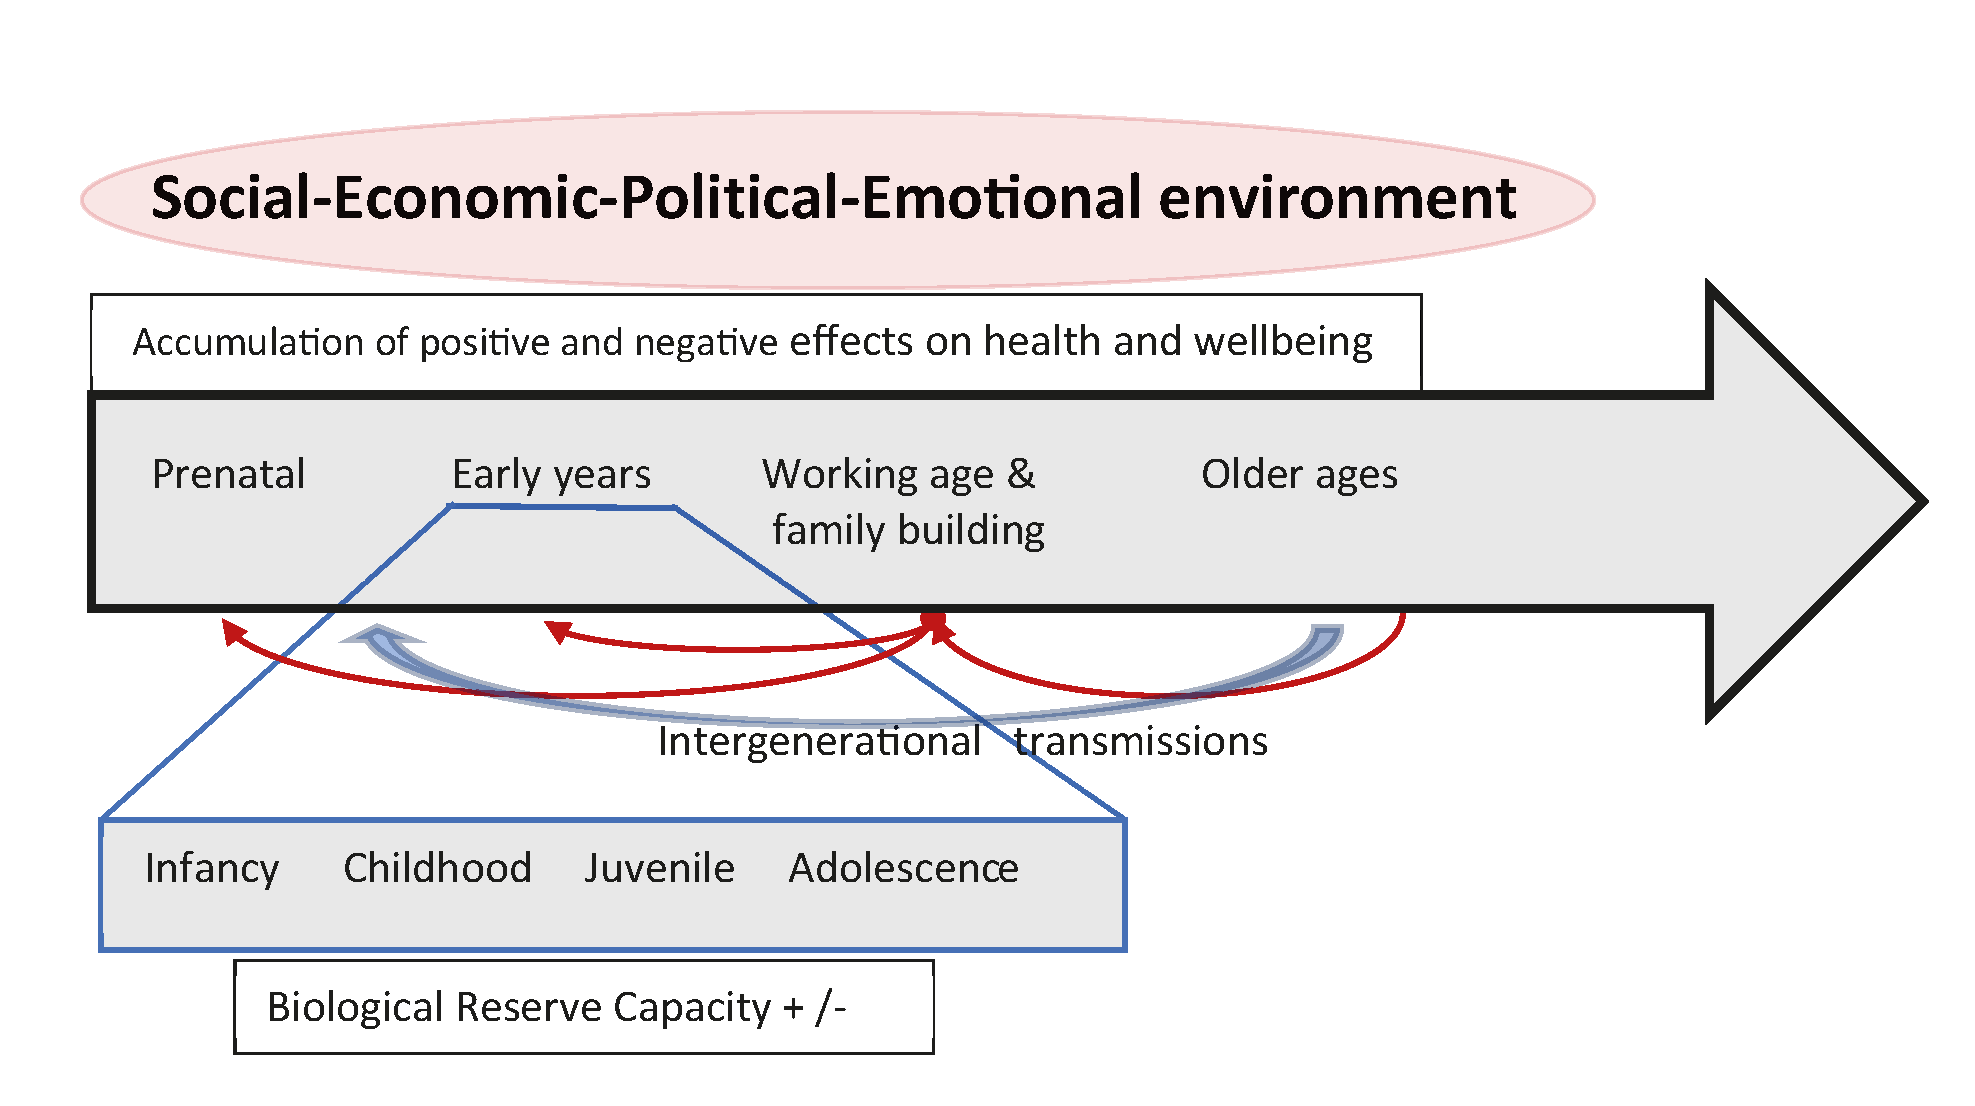
Figure 1 A conceptual framework of human biosocial development. Human development takes
place within complex social-economic-political-emotional (SEPE) environments (Bogin 2021b). The SEPE environment includes
kinship, marriage, and family systems (social), modes of food production, food
distribution, and all other economic activities (economic), the systems for the
administration of secular, religious, judicial, moral and other forms of power and
social control (political), and systems to ensure security, self-worth, love, and hope
(emotional) for people of all ages (Bogin et al.
2014). The SEPE environment regulates the distribution of resources needed
for human development. Members of a society receiving more than an adequate share of
these resources are likely to have positive health, wellbeing, and development.
Receiving less than an adequate share of resources results in negative effects on
health and wellbeing. These positive or negative effects accumulate during the life
course. All human beings live in social groups which include multiple generations and,
therefore, there are transmissions of biological (e.g., genetic and epigenetic) and
SEPE resources between generations. Along the line labelled ‘Intergenerational
transmissions’ there may be transfers of biological and SEPE resources, usually from
older generations to younger generations. Younger people may also provide transfers to
older generations and these transfers tend to increase from childhood to adolescence.
Working age adults may provide substantial transfers to older age adults, as well as
to younger generations. This is the case in many Bangladeshi families. The total
impact of the SEPE environment and the intergenerational transmissions results in
greater or lesser gains of ‘Biological Reserve Capacity’ during the
Infancy-to-Adolescence stages of growth, development, and maturation from birth to
adulthood.
The childhood stage ends at about age 6.9 years. The juvenile stage spans age 7.0 years
to the onset of the adolescent growth spurt, approximately age 10 for girls and age 12 for
boys in healthy, well-nourished populations. Juveniles are sexually immature, but
physically and mentally capable of providing for much of their own care. Human juveniles
have the physical capabilities to eat the adult-type diet, as the first permanent molars
and the central incisors have erupted by age 7 years. Human juveniles may produce some of
their own food intake but still require provisioning to achieve energy balance.
Adolescence includes the years of post-pubertal growth, approximately ages 10–18 years
for girls and ages 12–21 years for boys, including the adolescent growth spurt. Human
reproductive maturity takes place during the latter part of the adolescent stage. Even
when sexually mature and capable of producing enough food to exceed their own energy
requirements, teenage boys and girls remain immature in terms of sociocultural knowledge
and experience. These are required for successful adulthood in terms of reproduction and
parenting. Human adolescents in all societies, both boys and girls, engage in many types
of economic, social, sexual, and ideological apprenticeships that lead to greater adult
reproductive and sociocultural success. Adolescence ends with the eruption of the third
molar (if present) and the termination of growth of the skeleton.
The legend for Figure 1 describes features of the life span relevant to the present
analysis, and is based on theory and cross-cultural research from anthropology, human
biology, economics, political science, and related fields (Goodman and Leatherman 1998; Floud
et al. 2011; Stinson et al. 2012). This
trans-disciplinary approach to human health acknowledges the overarching importance of the
complex social-economic-political-emotional (SEPE) environments in which human life span
development takes place (Bogin 2021b). The model
in Figure 1 organizes the impact of SEPE environments according to life stages. Shown are
the chronological stages of the development of the person, from prenatal to older ages.
Just below is a line representing the intergenerational transmission of biological and
SEPE resources between developmental stages. These resources may be a combination of
accumulated health, wealth, social prestige, education, and other biosocial
characteristics. The effect of intergenerational transmissions on physical growth and
maturation are well-known from studies of secular trends, in which the average height of
different birth cohorts increases, or decreases, over time according to changes in the
quality of the SEPE environment (Bogin 2013; Bogin 2021a; Bogin
2021b). Intergenerational transmission may be from older to younger generations
or from younger to older, as when juveniles, adolescents, or younger adults contribute to
the well-being of older age adults.
2. Life history theory relates to the important role that early life conditions play
throughout the life course. Early life conditions affect the growth and maturation of the
body especially during the infancy and childhood periods (birth to age 36 months and 37
months to 7 years) when the rate of growth is relatively fast, and the infant or child is
dependent on others for feeding and protection. Early life nutrition and patterns of growth
are known to affect the maintenance of physiological processes in adulthood, the risks of
acute and chronic diseases, and the biological process of aging (Barker 2008; Crews and Bogin
2010; Thayer and Kuzawa 2011).
3. Another aspect of life history theory relates to biological reserve capacity (BRC),
which may be defined as those somatic resources possessed by organisms which exist above the
minimum required for necessary capacity, that is, the minimum needed to survive and
reproduce:
where denotes Total Achieved Capacity and denotes Necessary Capacity. Variation between individuals in
their levels of performance for different kinds of physical tasks reflects their BRC reserve
capacity. Systematic reviews of the literature finds that inadequate physical performance is
significantly and consistently associated with diminished BRC as measured by disability,
falls and mortality, and cognitive reserve capacity (CRC) as measured by cognitive
impairment and institutionalisation (Ferrucci et al.
2002; Crews and Bogin 2010). Considerable
costs to individuals, their families and the larger society accrue from these outcomes.
The lowest box of the conceptual model in Figure 1 is labelled ‘Biological Reserve
Capacity‘. Greater BRC acquired in early life allows greater investment in somatic
maintenance and repair, which slows the rate of aging, delays the accumulation of risks for
frailty, and allows for greater longevity survival (Crews
2003; Crews 2007; Finch and Crimmins 2004; Crimmins and
Finch 2006; Larke and Crews 2006; Bogin 2009).
Human life history is unusual in that the stages of childhood and adolescence are
evolutionarily novel (see Text Box 2), or at least far more highly developed and prolonged
than in any other mammal, even the apes and monkeys. Other primate species develop through
the infant, juvenile, and adult stages. The insertion of childhood and adolescent stages
into human life history provide more time for growth, development, and maturation than any
primate. If environments are favourable, with excesses of physical, biological, social, and
emotional resources above those needed to maintain necessary capacity, then human beings
have the potential for greater BRC at the start of adulthood and the initiation of
reproduction than any other primate. Others have hypothesized that the tendency to greater
BRC of humans at the onset of adulthood translates into the modal greater longevity of the
human species than other primate species (Crews
2003). Adverse environments will cause a reduction of BRC, usually expressed in
reduced body size, work capacity, cognitive functioning of young adults and their reduced
longevity (Bogin et al. 2007).
Accordingly, human BRC is accumulated during the stages of growth, development, and
maturation as shown in the following conceptual equation (Eq. 2):
is reserve capacity at age=t, and the life history stages of
gestation, infancy, etc. are developmental periods when RC may be gained or lost. This model
assumes that maternal investment and BRC accumulation during gestation is positive only.
Dire situations, in which embryonic or fetal reserves are depleted prior to birth, are
likely to preclude survival. Life stages after birth may have positive or negative
investment into BRC building, but the investments cannot be less than necessary capacity at
any stage. For humans, BRC building may continue into early adulthood, ending by age 25–35
years when the onsets of senescent declines are noted in many body systems. This conceptual
equation does not specify the units of BRC, that is, the way that gains or losses in BRC are
calculated. In the present research, the method used for the estimation of accrued BRC in
early life is based on the measurement of knee height. The rationale for this is explained
below under point 4.
Women in in all societies and of virtually all socioeconomic status (SES) are likely to
experience declines in somatic BRC with their first pregnancy. The demands of reproduction
mean that BRC is lost due to pregnancies, lactations, and other maternal investments in
offspring (Scholl et al. 1997; DaVanzo et al. 2008). Even for women of higher SES in
the wealthiest nations, pregnancy, birth, and infant care entail some loss of BRC (Doblhammer and Oeppen 2003). Due to the loss of BRC
with pregnancy and birth, the age at first reproduction for women is defined by some
researchers as equivalent to the age at onset of frailty and senescence (Westendorp and Kirkwood 1998; Doblhammer and Oeppen 2003; Larke and
Crews 2006; Hayflick 2007; Hsu et al. 2021).
4. Knee height (KH) is the proxy for accrued BRC in early life. The measurement of total
stature is the traditional method for estimating BRC, as completed height in early adulthood
represents the cumulative history of all positive and negative experiences (Bogin 2021a). Adult height, however, does not pinpoint
when those experiences occurred, because the human capacity for catch-up growth after a
period of under-nutrition or illness, and a growth period lasting 20 or more years, mean
that height at early adulthood may not reflect early life (i.e., infancy, childhood,
juvenile stages) conditions (Wit and Boersma 2002).
Interviews and questionnaires of adults may help understand early life conditions, but
memory is selective, and people often have reasons to withhold or distort information.
It is better to have a quantifiable, objective measure of health status for early life. KH
is one such measure. KH in adult women and men may be used to estimate the building of BRC
during infancy, childhood, and the juvenile stages of growth, that is, between birth and
puberty. Human body proportions at birth are typified by relatively short legs and a
relatively long head, neck, and trunk. Between birth and puberty the leg grows faster than
the upper body and the tibia grows faster than the femur (reviewed in Bogin and Varela-Silva
(Bogin and Varela-Silva 2010)). As a result, the
tibia is exposed to the qualities of the environment for post-natal growth, meaning the
‘material and moral conditions’ for growth as phrased by (Tanner 1987), for a longer time and with greater sensitivity than any of the other
major long bones contributing to stature. It has been known since the 1950s that in adverse
environments total stature is reduced, with legs more affected than the upper body and the
tibia more compromised than the femur (Leitch 1951;
Bogin and Varela-Silva 2010; Shirley et al. 2022). Operationally, KH is a
near-constant linear value from early adulthood until death -- it does not ‘shrink’ as does
total stature with age. Measurement of KH in adults, especially older people, provides a
proxy for total skeletal growth early in life (Chumlea
et al. 1985; Chumblea et al. 1998). The
consensus of research finds that shorter adult leg length, especially shorter tibial length,
is related to poorer health in the first decade after birth and may be associated with
accelerated frailty and aging, and a reduction in longevity (Chumlea et al. 1985; Prothro and
Rosenbloom 1993; Roubenoff and Wilson
1993; McEnry and Palloni 2010; Prince et al. 2011).
Methods
Participants
This article is based on a research project called ‘Migration, Nutrition and Ageing
Across the Lifecourse in Bangladeshi Families: A Transnational Perspective (MINA)’ (Thompson 2013; Thompson et al. 2012). Project MINA investigated two generations of Bengali
women in the United Kingdom (UK) and Bangladesh (BD). The UK sample included 40 mothers
(40-70 years old) who migrated to the UK, and one of their daughters (17-36 years old)
born in the UK (n= 20) or in BD (n=17), and 22 mother-daughter pairs of the same two age
groups in BD. The UK mothers and daughters resided in Cardiff, Wales and originated from
the Sylhet region of BD, where all the BD participants resided. As a UK ethnic minority,
many of the Bangladeshi community are socially disadvantaged and suffer from high levels
of disability, obesity, type-2 diabetes, and cardiovascular disease and rapid aging (Nazroo 2004; Sproston and Mindell 2006). Little is known about the causes. Project MINA took
an interdisciplinary approach toward discovery of the causes. The research team was
comprised of specialists from health psychology, ethnobotany, sociology, nutrition,
kinesiology, human factors/design, photography, and anthropology.
The field research for the present article was conducted between 2009-2011. The following
description about Bangladeshis in the United Kingdom (UK) and in Bangladesh is based on
information from the years of fieldwork. According to the UK Office for National
Statistics the population of England and Wales in mid-2009 numbered 54.8 million people
and was comprised of the following ethnic groups: White, British 83.35%, Asian or Asian
British 5.87%, Black or Black British 2.81%, Mixed 1.80%, and Chinese 0.82%. In the UK the
term ‘Asian’ refers to people from the former colonies of India, Pakistan, and Bangladesh.
The total ‘Asian’ population in the UK in 2009 was 1.4 million people and Bangladeshis
numbered 392 thousand or 28% of all ‘Asians’.
In the UK the Bangladeshi population is one of the fastest growing ethnic groups. UK
Bangladeshis are amongst the most socially disadvantaged and deprived ethnic groups (Ahmed and Rees Jones 2008). They have poorer
self-reported and measured health status indicated by higher rates of disability,
centralised obesity and chronic diseases such as type-2 diabetes and cardiovascular
disease (Sproston and Mindell 2006). Older
Bangladeshi women are particularly affected as they play a lead role in caretaking for
multiple generations within relatively large extended families, and many women struggle to
cope with the complex challenges of ageing, poverty, racism, and social exclusion (Gardner 2021; Phillipson et al. 2004).
Bangladeshi settlers to the UK first arrived in the 19th century but the major
migrations occurred during the 1950s and 1960s. As Ahmed and Rees Jones (Ahmed and Rees Jones 2008) explain, “These were mainly
male migrants who came with a view of temporary settlement but as time passed they settled
for the long term, and sought to bring wives and families over from
Bangladesh.”Approximately 95% of Bangladeshis in the UK originate from the Sylhet region
in the northwest of Bangladesh. Núñez de la Mora and colleagues (Núñez-de la Mora et al. 2007) reported that UK Bangladeshis are a
homogeneous group in terms of many biosocial characteristics such as their Sylhet origins,
shared socioeconomic status, “…low rates of intermarriage with other ethnic groups, thus
reducing genetic ‘noise,’…similar histories of migration, and…multigenerational population
that allows for recruitment of individuals who entered Britain at different life stages
(infancy, childhood, and adulthood).” Núñez de la Mora and colleagues continue by writing
that, “Most Bangladeshi migrants originate from relatively affluent, land-owning classes
in Sylhet who live in solid dwellings, have access to good nutrition, and have low levels
of energy expenditure…They are not, therefore, comparable to the rural, malnourished
populations…” of Bangladesh. Greater detail about the history of Bangladeshi immigration
to the UK is given in Text Box 2.
Text Box 2: Ships, factories, and restaurants: Sylhetis on the move
(From Katy Gardner (Gardner 2008). The
material here is quoted from pages 480-481, with permission of the author)
Whilst today most regions of Bangladesh send migrants to work as labourers in the
Middle East and Southeast Asia, for many generations Sylhetis have monopolized migration
to Britain. Indeed, Sylhet’s special relationship with the UK is just one reason why the
district is seen by many Bangladeshis as significantly different from the rest of the
country. Over the nineteenth century and into the twentieth, many Sylheti
lascars [meaning an Asian militiaman or seaman, especially those from
the Indian subcontinent, serving the British] ‘jumped ship’ in London, where they
stayed, seeking work as peddlers or in London’s hotels and restaurants (Choudhury 1993). Although originally men from
districts such as Noakhali and Chittagong were also lascars, by the
twentieth century Sylhetis dominated (Choudhury
1993). Crucially, particular individuals dominated the recruitment of labour,
leading to a ‘chain’ effect whereby men from particular villages and lineages gained
employment through the patronage of their relatives and neighbours.
The vast majority of Sylhetis first came to Britain in the 1950s and 1960s when the
second phase of migration to the UK took place. Prompted by a labour shortage after the
Second World War, the British authorities actively encouraged labour migration from
previous colonies and thousands of migrants embarked for the UK (Adams 1987; Choudhury
1993). Most Sylhetis initially found employment in heavy industry. These men were
‘transnationals’ par excellence: they worked and lived in Britain, but returned home as
often as they could, where they were still heavily involved in social networks of
kinship and village community.
Over the 1970s and into the 1980s, conditions started to change. Britain’s heavy
industry was in decline and many Sylheti men moved to London to seek employment in the
garment or restaurant trades. Crucially, a growing number started to bring their wives
and children to the United Kingdom (Peach
1996). This shift was partly the result of changing immigration laws, which many
rightly feared would soon make primary migration to Britain (without it involving
marriage to a British citizen) increasingly difficult. It also reflected wider changes
in the areas where many Bengalis were settled, in which mosques, shops selling halal
meat, and other community facilities were becoming established. Today, the Bangladeshi
population is one of the youngest and fastest growing in Britain and the process of
family reunification is largely complete. If not classed as a ‘family dependant’, it is
currently extremely difficult to obtain an entry visa to Britain from Sylhet. Indeed,
figures from the British High Commission in Dhaka show that of the Bangladeshis seeking
work permits over 2005-6, 90 per cent were from Sylhet and the vast majority were
refused.
Transnational marriage
Increasingly a new form of movement between Sylhet and Britain, is taking place. Whilst
in the 1970s and 1980s it was mostly wives who travelled to the UK to join their
husbands, today almost as many men apply for settlement visas to join their British
based wives. Foreign Office figures show that in 2005, 1,530 settlement visas were
granted to Bangladeshi grooms (with 330 refused), in contrast to 2,133 issued to brides
(with 590 refused). These figures have remained relatively stable since 2001.
Despite the relative affluence of Bangladeshis who migrated to the UK, Bangladesh is a
low-income nation with many problems that negatively impact health. The per capita gross
national product of Bangladesh amounts to less than 2% of that of the UK. In Bangladesh,
child and maternal malnutrition are common. At the time of the MINA project research there
was a 41% prevalence of underweight (weight-for-age z-score <-2) among children aged
less than five years and about 30% of women had a body mass index (BMI) of
<18.5kg/m2 which is the cut-off value for thin/undernourished (Ahmed et al. 2012). There was also a high prevalence
of deficiencies for iron, iodine, and other micro-nutrients among young infants,
adolescent girls, and women (Ahmed et al. 2012).
As of 2011, life expectancy at birth for BD women was 69 years compared with 82 years in
the UK, a difference of 16%, and the mortality rate for infants and children under five
years old per 1,000 live births was 46 for Bangladesh and only 5 for the UK (World Bank 2022). Many Bangladeshi women in the UK
who were born in Bangladesh report one or more child deaths, as shown in Table 1 for our
sample, indicating that life in Bangladesh is precarious even for these relatively
affluent families. Poor sanitation due to inadequate sewage and waste disposal systems,
limited water treatment, and the poor quality of health care characterize most of the
Sylhet region. In addition, there are seasonal floods which increase the likelihood of
infectious disease and scarcity of potable drinking water. People infected with intestinal
parasites are ubiquitous in both Sylhet and in recent migrants to the UK.
Wales is a constituent country that is part of the United Kingdom. It is bordered by
England to the east and the Irish Sea, Celtic Sea, and Bristol Channel to the north, west
and south. Cardiff is the capital city. In 2021 the population of Wales totalled 3,107,500
with 481,000 residents in Cardiff and 1,097,000 people in the greater Cardiff-Newport
metro region. An overview of demographic, economic and social conditions for Bangladeshis
in Cardiff may be found in reports from Project MINA (Thompson et al. 2012), from the Cardiff City Council (Cardiff and the Vale of Glamorgan 2017), and from news media (Day 2013). According to these sources, the region of
Cardiff where most of our Bangladeshi participants live is characterized by social
deprivation, high levels of unemployment, high rates of reported crime, poor educational
achievement rates, high levels of housing benefit claimants, high mortality rates and a
high percentage of low birth-weight babies.
Measurements
MINA was a cross-sectional study and participants were seen at data collection events or
in their homes between the years 2009-2011. Several types of social, psychological,
health, nutrition, and physical activity questionnaires were administered. Detailed
migration histories were collected. These questionnaires and interviews were conducted by
well-trained field workers who were native speakers of the languages of Bangla, Sylheti,
or English as appropriate. The interviews in Bangla or Sylheti were translated into
English. The data from these questionnaires and interviews, as well as from all
measurements described below, are available via Thompson (2013).
Each participant contributed a measurement of bone density, estimated by ultrasound of
the calcaneus bone of the foot (heel bone) and anthropometry. The later included height,
weight, sitting height, knee height, and waist circumference. All the anthropometric
measurements (except knee height, see below) were taken by one well-trained member of the
MINA team who followed standard protocols and used recommended equipment (Lohman et al. 1988).
Knee height (KH) was measured with a Harpenden anthropometer using a method modified from
the NHANES anthropometric manual (NHANES III
1988). The participant sat on a purpose-built stool with the soles of both feet on
the floor, the lower back and shoulders against the wall, looking straight ahead, with the
lower leg as perpendicular to the floor as possible (90-degree angle to the floor). KH was
measured as the distance from the floor to the proximal border of the patella (top of the
kneecap). Our method avoids contamination of the measurement with soft tissue, especially
fat, which has been shown to artificially inflate other linear skeletal measurements such
as sitting height (Bogin and Varela-Silva 2008;
Bogin and Varela-Silva 2010).
A lower limb physical function score (PFS) was assessed by the Guralnik Short Physical
Performance Battery (SPPB) (Guralnik et al.
1994). The SPPB is composed of tests for standing balance, walking speed, and
ability to rise from a chair without use of the arms. Each of these tests is performed in
the presence of an observer who records and scores the ability to perform the movement,
the number of movements completed, and/or the time taken for each movement. The SPPB has
demonstrated a high level of reliability and validity for adults aged 65 or older to
estimate lower body physical performance, frailty, and risk for mortality (Wang et al. 2020). Both the Bangladeshi mothers and
daughters were assessed with the SPPB to provide a continuum of age changes in physical
performance.
Statistical analysis
Descriptive statistics were used to estimate means, standard deviations, frequencies, and
percentages for all variables for categories of mothers, daughters, country of birth and
current country of residence. T-tests or ANOVA were used to estimate statistical
significance between comparison groups. Statistical significance was set at
p<0.05. Ridge regression was used to assess the relative influence
of predictor variables on outcome variables. Ridge regression is used because many of the
independent variables in the MINA data set are highly intercorrelated, for example total
number of pregnancies and total number of living offspring has a correlation coefficient
of r=0.85. All the anthropometric variables have similarly high correlations. Due to these
multicollinearities, it is not possible to obtain stable estimates for the regression
coefficients via ordinary least squares methods. Ridge regression adds a constant, called
lambda to the diagonal of the correlation matrix, which is then
re-standardized so that all diagonal elements are equal to 1.0. The off-diagonal elements
are divided by the constant. In other words, ridge regression artificially decreases the
correlation coefficients so that more stable estimates (beta
coefficients) can be computed. The value of lambda can vary from zero to infinity. When it
is zero the analysis is, essentially a conventional least-square multiple regression. A
large lamda value (about 4 or greater) eliminates most or all
associations between variables. A lambda of 0.10 was used in the present
analyses.
Another method used to assess the associations between independent and dependant
variables is the relatively new technique of St Nicholas House Analysis (SNHA). The name
is derived from a Christmas game played by children in Germany. The SNHA method also deals
with multivariate datasets with multicollinearity. SNHA calculates ranked correlations
(from most to least correlated) and produces a network graph for the visualization of
these associations in (Groth et al. 2019; Hermanussen et al. 2021). The SNHA network graph
arranges the independent and dependent variables as nodes and the associations between
them as edges. Edges direct the order of associations from one node (variable) to the next
one. The network graph is arranged in hierarchy of correlation coefficients based upon a
reversion chain of the correlation coefficients’ r2 values, ranked from
strongest to weakest. In essence, SNHA provides a directed graph that has a topological
ordering from independent variables with ‘earlier’ to ‘later’ influence on the dependent
variables. The performance of SNHA has been shown to be superior to other network graph
techniques, most of which use partial correlations for analysing bands and hubs (Groth et al. 2019). The calculations were conducted
with the programming language R (R Development Core Team
2022) version 3.6.3 which is a free software under the terms of the Free Software
Foundation’s GNU General Public License in source code form. The corresponding R-code is
available on request from Dr. Detlef Groth, University of Potsdam, Germany.
Results
Demographic characteristics
No difference in mean age exists between the UK and BD mothers, but BD residing daughters
were statistically younger than UK residing daughters (Table 1). All mothers were married or widowed and had completed fertility.
Mothers in both countries have a statistically equal number of pregnancies, number of live
born children, pregnancy loss, and relatively high fertility. Age at marriage and all
fertility data of the daughters are incomplete estimates, as 24 of 37 UK-living daughters
were married or divorced and only 7 of 22 BD-living daughters were married at the time of
data collection. The lower number of married daughters in BD reflects their younger age
and our decision to interview the BD-living women in the mother’s home – married BD
daughters would be living with their mother-in-law. Consequently, no value for ‘age at
final birth’ is given for daughters.
Table 1 Characteristics of the participants given as mean values (standard deviations)
or percentages. All values are as measured with no statistical adjustment for age
differences.
| |
Cardiff Mothers (n=40)+ |
Bangladesh Mothers (22) |
Cardiff Daughters
(37)++ |
Bangladesh Daughters (22) |
| Age (yr) |
55.3 (8.1)
Range=40-69 |
51.9 (8.8)
Range=40-70 |
27.4 (5.5)**
Range=17-36 |
22.8 (5.1)
Range=17-35 |
| Age when married (yr) |
16.3 (2.7) |
16.5 (3.3) |
18.7 (2.3) |
18.4 (3.8) |
| Age at 1st birth |
20.8 (4.2) |
23.2 (5.5) |
21.3 (2.2)
N=20 |
20.5 (2.6)
N=6 |
| Lag from marriage to 1st birth (years) |
4.3 (3.9)
|
5.6 (5.7)
|
2.6 (1.4)
N=20 |
1.8 (3.0)
N=6 |
| Age at final birth |
34.4 (6.7) |
35.8 (5.3) |
|
|
| Total pregnancies |
6.6 (2.0)
|
5.6 (2.1) |
2.9 (1.0)
N=20 |
2.9 (2.3)
N=7 |
| Number of living children |
5.6 (1.8) |
4.9 (1.6) |
2.6 (0.9) |
2.7 (1.5) |
| Height (cm) |
147.7 (6.2) |
148.8 (5.7) |
153.2 (5.8) |
152.7 (6.0) |
| Sitting height (cm) |
77.4 (3.7) |
76.4 (3.4) |
81.4 (2.4)** |
78.2 (3.0) |
| Sitting height ratio |
52.4 (1.5) |
51.3 (1.3) |
53.2 (1.4) |
51.2 (2.2) |
| Knee height (cm) |
45.9 (2.4) |
46.9 (2.4) |
46.7 (2.5) |
48.2 (2.3) |
| Weight (kg) |
66.0 (13.4)* |
53.5 (15.2) |
64.5 (14.5)** |
50.8 (10.6) |
| Waist (cm) |
97.9 (9.6)* |
82.5 (14.0) |
82.4 (13.0)** |
72.4 (8.3) |
| BMI (kg/m2) |
30.1 (5.2)* |
24.1 (6.4) |
27.5 (5.7)** |
21.8 (4.4) |
BMI
category¶
Underweight
Acceptable risk
Increased
risk
High risk |
0%
5%
30%
65% |
13.6%
40.9%
18.2%
27.3% |
0%
25.0%
22.5%
42%.5 |
22.7%
40.9%
22.7%
13.6% |
| Physical function scoreβ |
6.3 (3.0)* |
9.4 (1.9) |
10.8 (1.1) |
11.2 (0.8) |
Anthropometric status
Anthropometric values are reported without adjustment for age (Table 1). All women are of
short stature with a global mean of 150.5cm (sd= 6.4). Daughters are, on average, taller
than their mothers, but the difference is not statistically significant. KH of daughters
is significantly greater than mothers in Cardiff and Bangladesh. To better compare the
body proportions of these women, the sitting height ratio was calculated (SHR = [sitting
height/height] x100). This ratio standardizes for differences in height: a smaller value
indicates relatively longer legs for a given stature. There is no significant difference
in SHR between mothers and daughters. UK women have significantly greater SHR than BD
women, suggesting that UK women have relatively shorter legs for their height.
Daughters were divided into three groups: 1) born and living in the UK (UK-UK, n=20), 2)
living in the UK and born in BD (UK-BD, n=17), and 3) born and living in BD (BD-BD). The
mean age of migration for the UK-BD daughters is 8.2 (+/-7.5) years, with a lower quartile
of 3.0 and upper quartile of 12.0 years of age. The UK-UK and BD-BD daughters have
significantly greater KH than the UK-BD daughters (Figure
2, Table 2). UK-UK mean height is 3.8cm
greater than the UK-BD mean (p <0.05). Sitting height means do not
differ, indicating that all of the difference in stature between the two groups of
daughters is due to leg length. Further analysis indicates that 2.0cm (53%) of total
height difference is due to KH (tibia + foot) and 1.8cm is due to thigh length. This is
consistent with other research indicating that as stature increases the tibia elongates
more than the femur (Duyar and Pelin 2003).
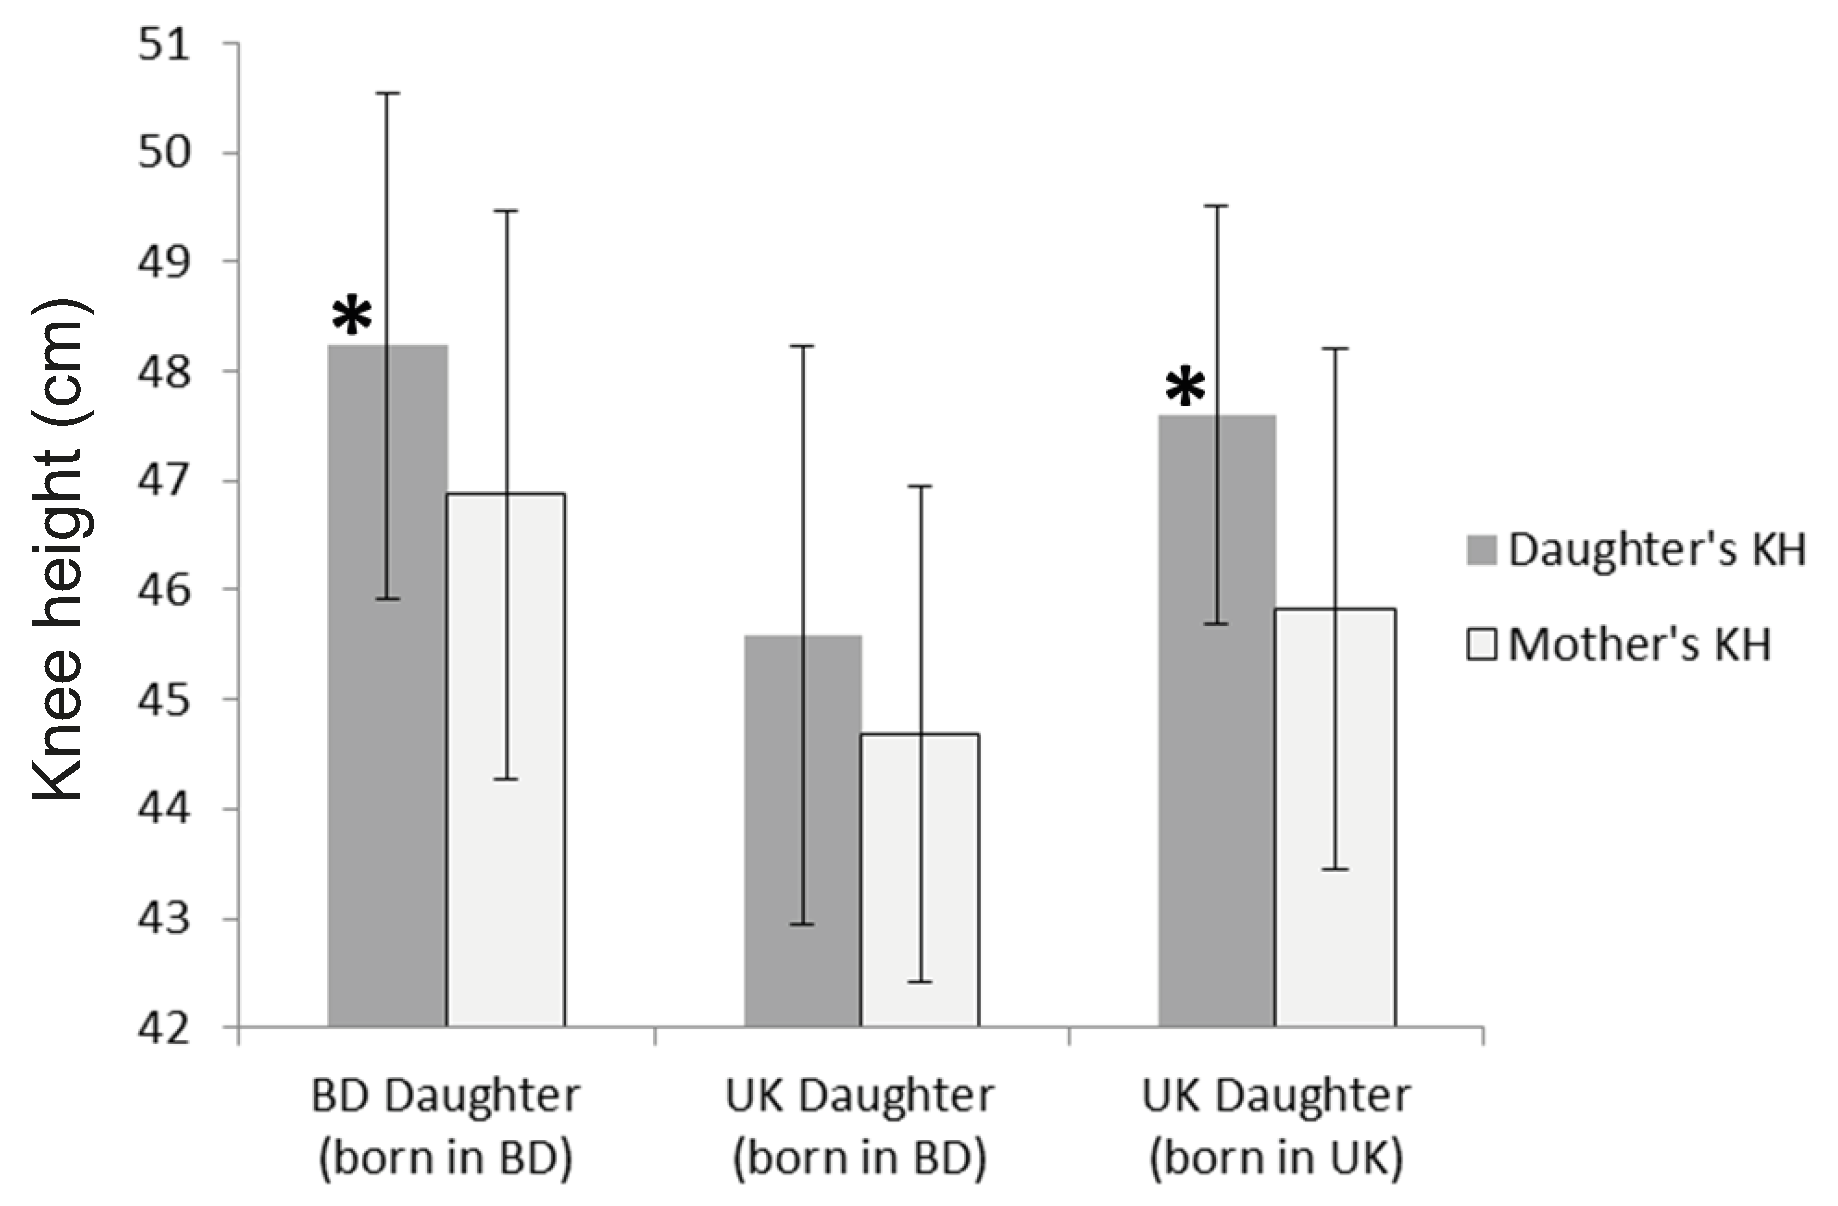
Figure 2 Knee height (KH) meaured in centimeters (cm) of daughters and mothers. The
asterisks (*) indicate that Bangladesh-living daughters and UK-living daughters born
in the UK have significantly greater KH than UK-living daughters born in Bangladesh (p
= 0.01).
Table 2 Means (+/- sd) and t-tests for height, sitting height, and knee height (all in
cm) of UK living daughters born in Bangladesh (UK-BD, n=17) or in the UK (UK-UK,
n=20).
|
UK-BD |
UK-UK |
t-value |
df |
p |
|
Mean (sd) |
Mean (sd) |
|
|
|
| Height |
151.0 (6.2) |
154.8 (5.0) |
-2.09 |
35 |
0.04 |
| Sitting height |
80.9 (2.3) |
81.7 (2.4) |
-1.05 |
35 |
0.30 |
| Knee height |
45.6 (2.7) |
47.6 (1.9) |
-2.69 |
35 |
0.01 |
UK-residing women have higher rates of overweight and obesity than BD-residing women as
indicated by body weight, waist circumference (WC) and BMI (Table 1). UK mothers are
especially overweight. Conversely, about one-fifth of all BD women are underweight.
Results from the SPPB indicate that total score declines with age for all women (Figure 3). All participants attempted each task of the
test. The daughters’ total scores decline with age, which was unexpected as the SPPB is
designed to measure declines in physical performance for adults aged 65 years and older.
Until age 65 all participants are expected to score a ‘perfect’ 12 on the SPPB. BD mothers
have significantly higher total scores than UK mothers. The average score for the UK
mothers falls below the test’s cut-off value of 7.0 for an increased risk of frailty.
Indeed, 21 individuals fall below 7.0, 6 are at or below a score of 2.0 with 2 women
scoring ‘0’, meaning that they were unable to perform any elements of the test.
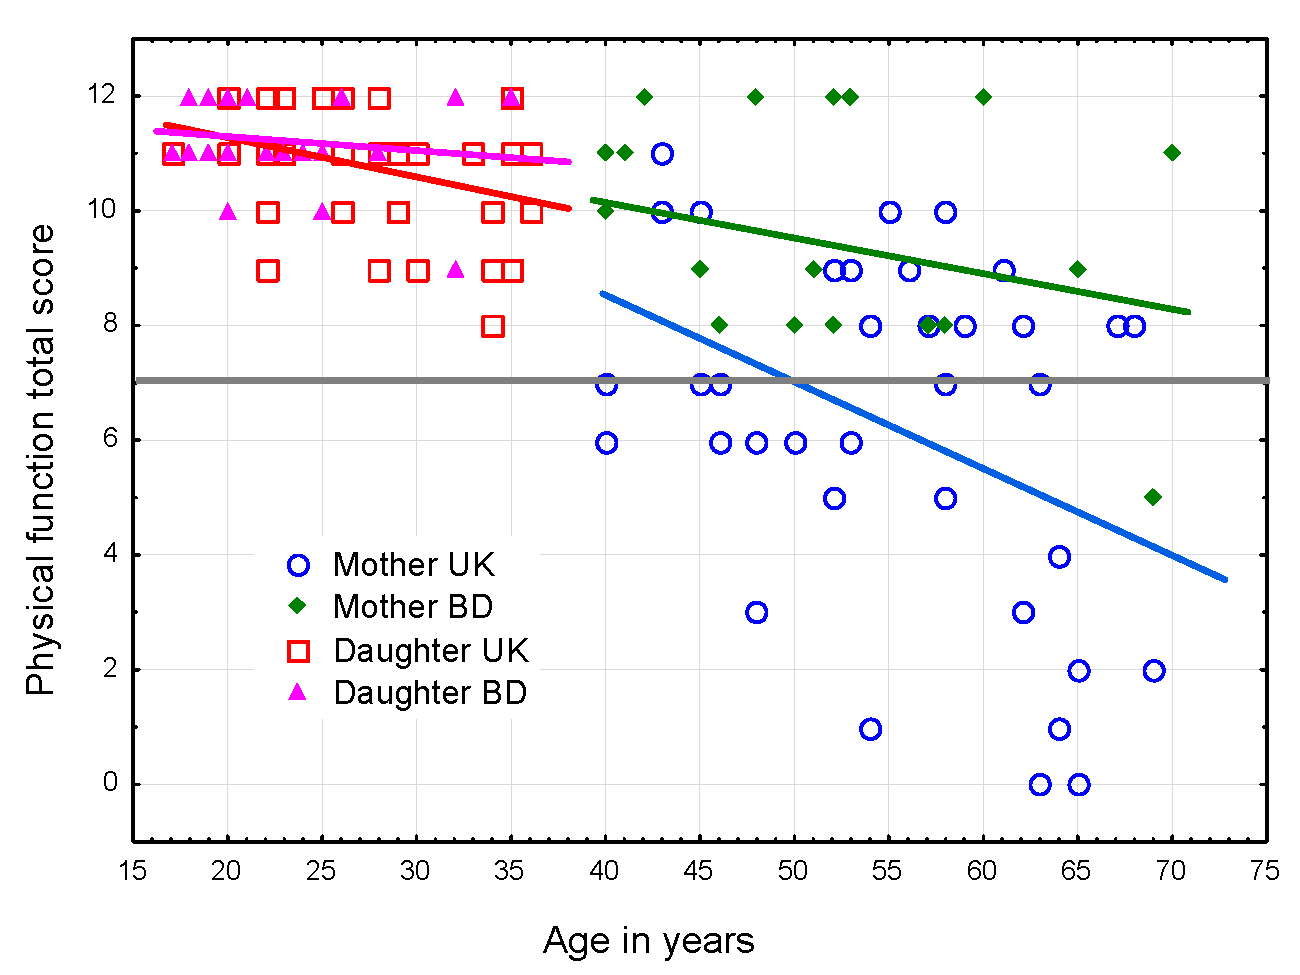
Figure 3 Change in the total score of the Guralnik Short Physical Performance Battery
(Guralnik et al. 1994) by age. Scores below
7 (the dotted line) indicate high risk for frailty and poor health
outcomes.
Knee height, physical performance, and biological reserve capacity
The influence of demographic, anthropometric, and nutritional status variables on
physical performance of the mothers was estimated by ridge regression. The model and the
estimates with a p-value of 0.05 or less are shown in Table 3. Prior to the ridge regression analysis, the
correlations between al variables were examined (Supplemental Table 1). Where high
multicollinearity existed between variables only one of those variables was chosen. All
the fatness variables, for example, were correlated at r = 0.9 or
greater. Waist circumference was chosen as the fatness variable because it is often the
most sensitive risk factor for metabolic disease and ageing in South Asians (Cameron et al. 2010).
Table 3 Ridge regression results for predictors of total score for the Guralnick Short
Physical Performance Battery for the Bangladeshi mothers. Variables entered into the
regression are current age, age at first birth, age at last birth, still menstruating
(yes/no), height, knee height, waist circumference, arm muscle area, education level,
age when married, total pregnancies, total living children, unsuccessful pregnancies,
time lag between marriage and first birth. Statistically significant predictors
(p < 0.05) are shown in the table.
| N= 52, R= 0.66, R²= .44, adjusted R²= .22§ ,
F(14,37)=2.02, p=0.04, lambda = 0.10 |
| |
Standardized
Beta |
SE |
beta |
SE |
t(38) |
p-value |
| Intercept |
|
|
16.29 |
11.53 |
1.41 |
0.16 |
| Current Age |
-0.54 |
0.17 |
-0.20 |
0.06 |
-3.12 |
<0.01 |
| Waist circumference |
-0.35 |
0.15 |
-0.08 |
0.03 |
-2.42 |
0.02 |
| Knee height |
+0.38 |
0.18 |
0.49 |
0.23 |
2.11 |
0.04 |
Older age for mothers is most strongly predictive of a lower physical function score (the
negative sign of the standardized beta for the PFS, Table 3). Greater KH is the next most
predictive of a higher PFS. Greater waist circumference predicts lower PFS. Taken
together, these variables account for 22% of the variance in score for the SPPB among the
mothers. This value is the adjusted R2, which
is a modification of R2 that corrects for the
number of explanatory terms in a model and better estimates the amount of variance
explained by the model for the population instead of just the sample (Field 2009).
A ridge regression analysis for the daughters found results similar to those for the
mothers (findings not shown). Older age is predictive of lower PFS and greater KH is
predictive of higher PFS. Greater stature predicts lower PFS, but this is likely due to
multicollinearity with KH as the correlation between height and PFS is only
r = 0.06. There is a significant effect of migration status, with UK-BD
daughters having lower PFS than UK-UK and BD-BD daughters. The regression model for the
daughter’s accounts for 21% of the variance (adjusted
R2) in PFS.
St Nicholas House Analysis
The SNHA was performed on a larger set of variables than for the ridge regression and
included variables for which there is high multicollinearity. This is possible because the
SNHA algorithm uses pairwise absolute correlation values for all variables to find
association chains where the order of correlations has both a forward chain and a reversed
counterpart (see Supplementary Materials Figure S1). The SNHA algorithm evaluates all
these association chains to create a graph to visualize positive and negative correlations
within the extensive complicated matrix of interacting variables within the data set. The
output of SNHA is a visualized spatial relationship between variables that is far less
biased by multicollinearity than conventional correlation or regression analysis.
The SNHA results are shown in Figure 4. In this
network graph the independent variables ‘age’ and ‘knee height’ are most closely
associated with the dependent variable, score on the SPPB. The independent variable ‘waist
circumference’ is more distantly associated with SPPB score and is mediated by the
variables ‘sitting height’, ‘height’, and ‘knee height’. The differences in results
between the SNHA and ridge regression analysis are considered in the discussion
section.
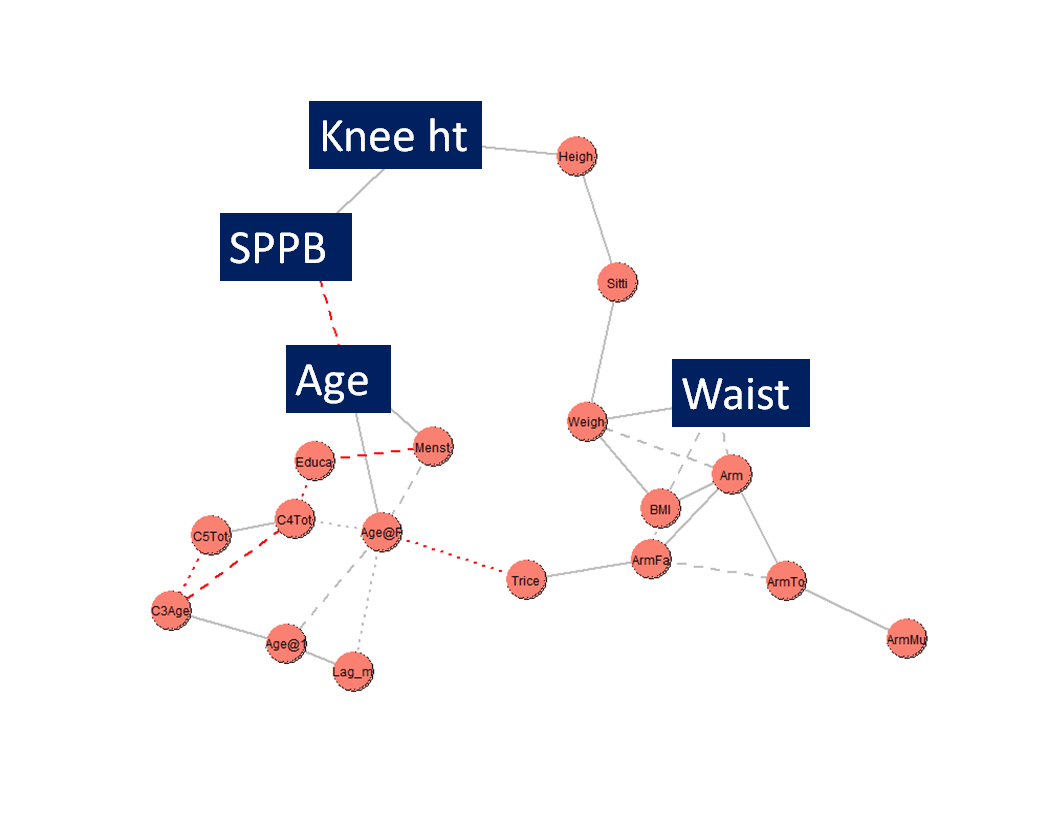
Figure 4 St. Nicholas House Analysis network graph of the associations between the
dependent variable SPPB (score on the Short Physical Performance Battery) and the
independent variables ‘Age’ (age at time of measurement), ‘Knee ht’ (knee height),
‘Heigh’ (height), ‘Sitti’ (sitting height), ‘Weigh’ (weight), ‘Waist’ (waist
circumference), ‘Arm’ (mid-upper arm circumference), ‘BMI’ (body mass index), ‘Armfa’
(arm fat area), ‘ArmTo’ (arm total area), ‘ArmMu’ (arm muscle area), ‘Trice’ (triceps
skinfold), ‘Age@F’ (age at first birth), ‘Menst’ (current menstruation, yes/no),
‘Educ’ (education level), ‘C4Tot’ (total number of pregnancies), ‘C5Tot’ (total living
offspring), ‘C3Age’ (age at marriage), ‘Age@1’ (age at first birth), ‘Lag_m’ (number
of years between marriage and first birth). The statistically significant variables
are in BOLD in this list and highlighted in the figure.
Discussion
Project MINA offers a novel perspective on ways in which early-life human growth,
development, and maturation associate with later life physical performance, health, and
ageing. Few other studies compare two human populations of the same ethnicity in terms of
two generations and two locations – the home country and the ‘diaspora’.
The findings reported here support the first hypothesis that pre-adult gains in biological
reserve capacity, proxied by KH, predict higher levels of physical performance and lower
risk for frailty at later ages, proxied by the Guralnik Short Physical Performance Battery
(Guralnik et al. 1994). Even though the SPPB is
designed for women 65 years and older, we note age-related declines in physical performance
for all participants. Lifestyles in BD versus UK and the timing of migration may explain the
patterns of physical performance in our participants. Interviews and ethnographic
observations with participants indicate that BD-living mothers and daughters perform more
daily physical activity related with lower body strength and flexibility, including walking
outdoors, carrying bundles, taking stairs, doing housework without mechanical/electrical
appliances, and squatting as a standard position when cooking and eating. Several BD-living
families had small agricultural holdings and tended livestock, while others were relatively
wealthy, and activities were predominantly household-related in nature. These types of
moderate to vigorous physical activities are recommended to prevent losses in physical
performance (Denvir and Gray 2009; Department of Health 2011). In contrast, the Health
Survey for England reports that Bangladeshi women living in the UK have the lowest
self-reported levels of physical activity of all ethnic groups (Sproston and Mindell 2006).
Our results justify the use of knee height as a biomarker of acquired biological reserve
capacity. The difference in KH between the UK-residing daughters born in BD versus those
born in the UK cannot be explained as simple genetic inheritance. When mothers and daughters
of the two groups were compared it was found that only 53% of the mothers of BD-born
daughters had a shorter KH than the daughter. In contrast, 80% of mothers with UK-born
daughters have a shorter KH than their daughter. This is a biologically significant
difference as well as a statistically significant difference (p=0.04). It
seems most likely that prior to migration to the UK the BD-born daughters experienced higher
levels of stressors that delay and reduce skeletal growth than did the UK-born daughters.
These stressors may have been a combination of nutritional deficiency, infectious disease
exposure (including parasites), and socioeconomic-emotional factors. In particular, mothers
and their children who eventually migrated to the UK were often left at home in BD for one
or more years after the husband/father migrated. The eventual migrants report after
husbands/fathers left they experienced declines in standard of living and considerable
feelings of insecurity in BD. These types of adverse early life experiences are reported in
another study of 19 to 39-year-old Bangladeshi women who migrated to London at different
ages (Núñez-de la Mora et al. 2007). These
researchers also reported that those migrants who spent their pre-pubertal years in the UK
had higher progesterone levels and greater ovulatory frequency than those who migrated at
later ages (Núñez-de la Mora et al. 2008). Both
higher progesterone levels and greater ovulatory frequency are additional biomarkers of
biological reserve capacity.
The second hypothesis, that the strength of this relationship between KH and physical
performance is moderated by age at marriage and at first reproduction, is not statistically
significant. Other research finds positive, negative and neutral effects between fertility
variables and later life health (Westendorp and Kirkwood
1998; Doblhammer and Oeppen 2003; Mirowsky 2005; Hayflick 2007; Spence 2008; Kuningas et al. 2011; Lockhart et al. 2017; Hsu et al. 2021).
Several of these studies find that lifestyle choices, such as smoking and alcohol usage,
have major confounding effects on the fertility-health findings. Needed are studies of the
total energy budget of women, including trade-offs with disease, socio-economic status, as
well as the costs of investment in one’s own offspring throughout their life, the children
of others (e.g., nieces, nephews, adoptions), and grandchildren (Jasienska 2009).
The low physical performance scores and high fatness of the UK mothers are likely related
to each other and are of clinical concern. Some Bangladeshi women appear to regard
‘plumpness’ as a sign of good health, greater wealth, and higher social status (Asghar et al. 2010). Nevertheless, research with South
Asians in their homeland and in Europe finds a nearly monotonic increase in the incidence of
type-2 diabetes and its comorbidities with greater waist circumference (Cameron et al. 2010; Feng et al. 2019).
Bangladeshi women, particularly immigrants, in the UK suffer from social isolation due to
poor English language skills, fear of unfamiliar social environments, lack of knowledge of
social services, and fear of the cold (Gray 2003;
Merrell et al. 2005; Gardner 2008; Thompson et al.
2012). A survey of social isolation among minority people 65+ years old living in
the UK finds that 40% of the Bangladeshis interviewed report ‘often’ feeling lonely. This
contrasts with an average report of 8–10% for white British respondents (Victor et al. 2012). These researchers write that,
“Loneliness is important because it is associated with a range of negative outcomes
including low levels of physical activity, poor physical and mental health, elevated
mortality, and increased use of services” (p. 78). Culturally tailored interventions, such
as exercise/dance classes reserved for BD women only, may help alleviate both the lack of
physical activity and loneliness. The MINA project provided a ‘Bollywood-style’ dance
session at our data collection events, which were held at a community leisure centre
familiar to the participants. Virtually all physically able Bangladeshi mothers and
daughters participated and highlighted these dance sessions as a positive aspect of their
involvement Project MINA.
A strength of our analysis is the use of both traditional regression and St Nicholas House
Analysis. The conventional output of regression analysis is the p-value of
an association between the dependant variable (SPPB score) and an independent variable. The
ridge regression results were statistically significant for the independent variables
‘current age’ (p<0.01), ‘waist circumference’ (p=0.02),
and ‘knee height’ (p=0.04). This type of statistical significance may be
called ‘p wisdom’, but the value of such ‘p wisdom’ has
been questioned (Amrhein et al. 2019). SNHA
overcomes some of the concerns with ‘p wisdom’ by estimating associations
via the hierarchy and the priority of correlations in datasets with high multicollinearity.
In the present case, SNHA reports that KH is the more important mediator of SPPB score than
is waist circumference. This makes biological sense because the priority of growth is a
person’s KH, which is established during early life, between birth and about age 10 years,
while waist circumference is established in later life.
The major limitation to this study is the modest sample size. To overcome this limitation,
we compared our findings for height, weight, fatness, and fertility to those reported from
the larger sample of the Health Survey for England (Sproston and Mindell 2006). Our Cardiff sample of 17-to-36-year-old women averages
one year older and 3cm shorter than same age Bangladeshi women in England. Cardiff women
aged 40-70 years old average 3 years older and 4cm shorter. All the Cardiff women average
3kg heavier and 2 BMI points higher than Bangladeshi women in England. Mean waist
circumference is 1cm less for 17-to-36-year-old women in Cardiff, but 6cm more for the
Cardiff women aged 40-69 years. Shorter average stature and higher average weight, BMI, and,
for the older women, greater waist circumference, are indicators of poorer early life and
current health for the Cardiff sample.
Another limitation is that our method to measure KH is different from many other studies
which makes direct comparison of KH data difficult, however relative lengths of the lower
leg and total leg to total stature are possible to compute. A strength of our method is that
KH is uncontaminated with soft tissue.
In conclusion, KH of adult women may serve as an indicator of early life health and a
predictor of later life frailty risk. Increased frailty predisposes to a higher risk for
falls, skeletal trauma, and poor overall health. Greater abdominal fat may impair physical
function, lead to more frailty, and increase the risk of coronary disease and metabolic
conditions such as type-2 diabetes. International migration is associated with social
isolation, poorer health status, and greater frailty for both generations of Bangladeshi
women. It is likely that these findings apply to other minority communities and have social
policy and clinical relevance for added attention to early life health, nutritional balance,
and emotional well-being. Protecting and enhancing early life health forestalls frailty in
later life, may save national health systems considerable expense, and enriches the personal
lives of older people and their families.
Appendix
Figure S1 Model of St Nicholas House Analysis forward correlation chain (A>B>C>D)
and chain reversion (D>C>B>A).
Table S1 Product-moment correlation matrix of variables in the original dataset. Values
in bold font style have an association of p ≤ 0.05.
| Variable |
Age |
Age@ 1st Child |
Age@ Final Child |
Menstrual periods |
Height |
Sitting height |
Knee height |
Weight |
Arm |
Waist |
Triceps |
Arm muscle area |
Arm fat area |
BMI |
Education level |
Age@ Marriage |
Total pregnancies |
Total living children |
Unsuccessful pregnancies |
Lag_ marry-birth1 |
SPPB total_ score |
| Age |
1.00 |
0.32 |
0.69 |
-0.68 |
-0.11 |
-0.17 |
-0.10 |
-0.33 |
-0.15 |
-0.16 |
-0.25 |
0.09 |
-0.22 |
-0.33 |
-0.38 |
0.05 |
0.40 |
0.30 |
0.32 |
0.30 |
-0.43 |
| Age@1stChild |
|
1.00 |
0.45 |
-0.12 |
0.13 |
-0.04 |
0.23 |
-0.13 |
-0.11 |
-0.15 |
-0.17 |
0.04 |
-0.17 |
-0.19 |
0.21 |
0.39 |
-0.11 |
-0.24 |
0.11 |
0.79 |
0.06 |
| Age@FinalChild |
|
|
1.00 |
-0.55 |
-0.20 |
-0.27 |
-0.15 |
-0.35 |
-0.25 |
-0.22 |
-0.40 |
0.11 |
-0.36 |
-0.32 |
-0.36 |
0.14 |
0.41 |
0.33 |
0.28 |
0.39 |
-0.20 |
| Menstrual periods |
|
|
|
1.00 |
0.16 |
0.14 |
0.21 |
0.40 |
0.22 |
0.27 |
0.34 |
-0.08 |
0.31 |
0.39 |
0.44 |
-0.04 |
-0.34 |
-0.36 |
-0.14 |
-0.10 |
0.17 |
| Height |
|
|
|
|
1.00 |
0.74 |
0.80 |
0.41 |
0.18 |
0.24 |
0.08 |
0.18 |
0.13 |
0.11 |
0.17 |
0.03 |
-0.23 |
-0.21 |
-0.09 |
0.12 |
0.10 |
| Sitting height |
|
|
|
|
|
1.00 |
0.38 |
0.52 |
0.32 |
0.40 |
0.30 |
0.13 |
0.32 |
0.32 |
0.20 |
0.05 |
-0.26 |
-0.18 |
-0.18 |
-0.08 |
-0.13 |
| Knee height |
|
|
|
|
|
|
1.00 |
0.31 |
0.09 |
0.16 |
0.01 |
0.12 |
0.05 |
0.08 |
0.15 |
0.00 |
-0.10 |
-0.11 |
0.01 |
0.24 |
0.30 |
| Weight |
|
|
|
|
|
|
|
1.00 |
0.88 |
0.92 |
0.72 |
0.48 |
0.83 |
0.95 |
0.26 |
-0.10 |
-0.16 |
-0.10 |
-0.13 |
-0.07 |
-0.05 |
| Arm |
|
|
|
|
|
|
|
|
1.00 |
0.87 |
0.76 |
0.62 |
0.90 |
0.90 |
0.16 |
-0.17 |
-0.10 |
-0.00 |
-0.19 |
-0.01 |
-0.14 |
| Waist |
|
|
|
|
|
|
|
|
|
1.00 |
0.67 |
0.52 |
0.78 |
0.92 |
0.14 |
-0.14 |
-0.01 |
0.06 |
-0.06 |
-0.07 |
-0.22 |
| Triceps |
|
|
|
|
|
|
|
|
|
|
1.00 |
-0.04 |
0.96 |
0.76 |
0.24 |
-0.16 |
-0.20 |
-0.17 |
-0.10 |
-0.07 |
-0.16 |
| Arm muscle area |
|
|
|
|
|
|
|
|
|
|
|
1.00 |
0.23 |
0.45 |
-0.07 |
-0.08 |
0.08 |
0.20 |
-0.16 |
0.10 |
-0.04 |
| Arm fat area |
|
|
|
|
|
|
|
|
|
|
|
|
1.00 |
0.86 |
0.21 |
-0.19 |
-0.16 |
-0.10 |
-0.15 |
-0.06 |
-0.14 |
| BMI |
|
|
|
|
|
|
|
|
|
|
|
|
|
1.00 |
0.22 |
-0.12 |
-0.11 |
-0.04 |
-0.12 |
-0.12 |
-0.11 |
| Education level |
|
|
|
|
|
|
|
|
|
|
|
|
|
|
1.00 |
0.22 |
-0.38 |
-0.33 |
-0.24 |
0.08 |
0.21 |
| Age@Marriage |
|
|
|
|
|
|
|
|
|
|
|
|
|
|
|
1.00 |
-0.38 |
-0.35 |
-0.20 |
-0.25 |
-0.11 |
| Total pregnancies |
|
|
|
|
|
|
|
|
|
|
|
|
|
|
|
|
1.00 |
0.86 |
0.60 |
0.14 |
-0.06 |
| Total living children |
|
|
|
|
|
|
|
|
|
|
|
|
|
|
|
|
|
1.00 |
0.12 |
-0.02 |
-0.02 |
| Unsuccessful Preg nancies |
|
|
|
|
|
|
|
|
|
|
|
|
|
|
|
|
|
|
1.00 |
0.25 |
-0.10 |
| Lag_marry-birth1 |
|
|
|
|
|
|
|
|
|
|
|
|
|
|
|
|
|
|
|
1.00 |
0.14 |
| SPPB Total score |
|
|
|
|
|
|
|
|
|
|
|
|
|
|
|
|
|
|
|
|
1.00 |
Acknowledgements
This article is part of special issue of Human Biology & Public Health
dedicated to the memory of Dr Jaydip Sen. Dr Sen, his wife, and daughter provided much
support and friendship during my visit to India in 2018. It was my honour to work with Dr
Sen and to be his co-author.
This work was supported by Grant No. RES-354-25-0002 of the Economic & Social Research
Council, New Dynamics of Ageing Programme, UK. Members of the MINA research team were Janice
L Thompson, Diane Harper, Joy Merrell, Jasmin Chowdhury, Michael Heinrich, Vanja Garaj,
Bablin Molik, and Barry Bogin. Thanks to editors of this special issue: Kaushik Bose,
Christiane Scheffler and Michael Hermanussen.
References
Adams, C. (Ed.) (1987). Across seven seas and
thirteen rivers. Life stories of pioneer Sylhetti settlers in Britain. London, THAP
Books.
Ahmed, N./Rees Jones, I. (2008). 'Habitus and
bureaucratic routines', cultural and structural factors in the experience of informal
care. Current Sociology 56 (1), 57–76.
Ahmed, T./Mahfuz, M./Ireen, S./Ahmed, A. M.
S./Rahman, S./Islam, M. M./Alam, N./Hossain, M. I./Rahman, S. M. M./Ali, M.
M./Choudhury, F. P./Cravioto, A. (2012). Nutrition of children and women in Bangladesh:
trends and directions for the future. Journal of Health, Population and Nutrition 30
(1), 1–11. https://doi.org/10.3329/jhpn.v30i1.11268.
Amrhein, V./Greenland, S./McShane, B. (2019).
Scientists rise up against statistical significance. Nature 567 (7748), 305–307.
https://doi.org/10.1038/d41586-019-00857-9.
Asghar, S./Magnusson, A./Khan, A./Ali, K./Hussain,
A. (2010). In Bangladesh, overweight individuals have fewer symptoms of depression than
nonoverweight individuals. Obesity 18 (6), 1143–1145. https://doi.org/10.1038/oby.2009.332.
Barker, D. J. P. (2008). Human growth and
cardiovascular disease. Nestle Nutrition Workshop Series. Paediatric Programme 61,
21–38. https://doi.org/10.1159/0000113163.
Bogin, B. (2009). Childhood, adolescence, and
longevity: A multilevel model of the evolution of reserve capacity in human life
history. American Journal of Human Biology 21 (4), 567–577. https://doi.org/10.1002/ajhb.20895.
Bogin, B. (2013). Secular changes in childhood,
adolescent and adult stature. Nestle Nutrition Institute Workshop Series 71, 115–126.
https://doi.org/10.1159/000342581.
Bogin, B. (2021a). Patterns of Human Growth.
Cambridge University Press.
Bogin, B. (2021b).
Social-Economic-Political-Emotional (SEPE) factors regulate human growth. Human Biology
and Public Health 1. https://doi.org/10.52905/hbph.v1.10.
Bogin, B./Bragg, J./Kuzawa, C. (2014). Humans are
not cooperative breeders but practice biocultural reproduction. Annals of Human Biology
41 (4), 368–380. https://doi.org/10.3109/03014460.2014.923938.
Bogin, B./Silva, M. I. V./Rios, L. (2007). Life
history trade-offs in human growth: adaptation or pathology? American Journal of Human
Biology 19 (5), 631–642. https://doi.org/10.1002/ajhb.20666.
Bogin, B./Smith, B. H. (2012). Evolution of the
human life cycle. In: Sara Stinson/Barry Bogin/Dennis O'Rourke (Eds.). Human biology. An
evolutionary and biocultural perspective. 2nd ed. Hoboken, NJ, Wiley-Blackwell,
515–586.
Bogin, B./Varea, C./Hermanussen, M./Scheffler, C.
(2018). Human life course biology: A centennial perspective of scholarship on the human
pattern of physical growth and its place in human biocultural evolution. American
Journal of Physical Anthropology 165 (4), 834–854. https://doi.org/10.1002/ajpa.23357.
Bogin, B./Varela-Silva, M. I. (2008). Fatness
biases the use of estimated leg length as an epidemiological marker for adults in the
NHANES III sample. International Journal of Epidemiology 37 (1), 201–209. https://doi.org/10.1093/ije/dym254.
Bogin, B./Varela-Silva, M. I. (2010). Leg length,
body proportion, and health: a review with a note on beauty. International Journal of
Environmental Research and Public Health 7 (3), 1047–1075. https://doi.org/10.3390/ijerph7031047.
Cameron, A. J./Sicree, R. A./Zimmet, P.
Z./Alberti, K. G. M. M./Tonkin, A. M./Balkau, B./Tuomilehto, J./Chitson, P./Shaw, J. E.
(2010). Cut-points for waist circumference in Europids and South Asians. Obesity 18
(10), 2039–2046. https://doi.org/10.1038/oby.2009.455.
Cardiff and the Vale of Glamorgan (2017).
Population needs assessment: for the Social Services and Well-being (Wales) Act 2014.
Available online at https://web.archive.org/web/20220414111245/http://www.cvihsc.co.uk/wp-content/uploads/2017/02/Population-Needs-Assessment-1.pdf
(accessed 2/17/2023).
Choudhury, Y. (1993). The roots and tales of the
Bangladeshi settlers. Birmingham, Sylheti Social History Group.
Chumblea, W. C./Gou, S. S./Wholihan, K./Cockram,
D./Kuczmarski, R. J./Johnson, C. L. (1998). Stature prediction equations for elderly
non-Hispanic White, non-Hispanic black, and Mexican-American persons developed from
NHANES III data. Journal of the American Dietetic Association 98 (2), 137–142. https://doi.org/10.1016/S0002-8223(98)00036-4.
Chumlea, W. C./Roche, A. F./Steinbaugh, M. L.
(1985). Estimating stature from knee height for persons 60 to 90 years of age. Journal
of the American Geriatrics Society 33 (2), 116–120. https://doi.org/10.1111/j.1532-5415.1985.tb02276.x.
Cole, L. C. (1954). The population consequences of
life history phenomena. The Quarterly Review of Biology 29 (2), 103–137. https://doi.org/10.1086/400074.
Crews, D. E. (2003). Human senescence.
Evolutionary and biocultural perspectives. Cambridge, Cambridge University
Press.
Crews, D. E. (2007). Senescence, aging, and
disease. Journal of Physiological Anthropology 26 (3), 365–372. https://doi.org/10.2114/jpa2.26.365.
Crews, D. E./Bogin, B. (2010). Human life history
evolution: growth, development, and senescence. In: Clark Spencer Larsen (Ed.). A
companion to biological anthropology. 2nd ed. John Wiley & Sons.
Crimmins, E. M./Finch, C. E. (2006). Infection,
inflammation, height, and longevity. Proceedings of the National Academy of Sciences of
the United States of America 103 (2), 498–503. https://doi.org/10.1073/pnas.0501470103.
DaVanzo, J./Hale, L./Razzaque, A./Rahman, M.
(2008). The effects of pregnancy spacing on infant and child mortality in Matlab,
Bangladesh: how they vary by the type of pregnancy outcome that began the interval.
Population studies 62 (2), 131–154. https://doi.org/10.1080/00324720802022089.
Day, L. (2013). How Bangladeshi women in Wales are
worse off than those in their own country. Available online at https://www.walesonline.co.uk/news/wales-news/bangladeshi-women-living-cardiff-suffer-2959356
(accessed 2/17/2023).
Denvir, M. A./Gray, G. A. (2009). Run for your
life: exercise, oxidative stress and the ageing endothelium. The Journal of physiology
587 (Pt 17), 4137–4138. https://doi.org/10.1113/jphysiol.2009.178624.
Department of Health (2011). UK Physical Activity
Guidelines. Available online at http://www.dh.gov.uk/en/Publicationsandstatistics/Publications/PublicationsPolicyAndGuidance/DH_127931.
(accessed 11/3/2022).
Doblhammer, G./Oeppen, J. (2003). Reproduction and
longevity among the British peerage: the effect of frailty and health selection.
Proceedings. Biological sciences 270 (1524), 1541–1547. https://doi.org/10.1098/rspb.2003.2400.
Duyar, I./Pelin, C. (2003). Body height estimation
based on tibia length in different stature groups. American Journal of Physical
Anthropology 122 (1), 23–27. https://doi.org/10.1002/ajpa.10257.
Feng, L./Naheed, A./Silva, H. A. de/Jehan,
I./Raqib, R./Islam, M. T./Luke, N./Kasturiratne, A./Farazdaq, H./Senan, S./Jafar, T.
H./Cobra-Bps, S. G. (2019). Regional Variation in Comorbid Prediabetes and Diabetes and
Associated Factors among Hypertensive Individuals in Rural Bangladesh, Pakistan, and Sri
Lanka. Journal of obesity 2019, 4914158. https://doi.org/10.1155/2019/4914158.
Ferrucci, L./Cavazzini, C./Corsi, A./Bartali,
B./Russo, C. R./Lauretani, F./Corsi, A. M./Bandinelli, S./Guralnik, J. M. (2002).
Biomarkers of frailty in older persons. Journal of endocrinological investigation 25 (10
Suppl), 10–15.
Field, A. (2009). Discovering statistics using
SPSS (and sex and drugs and rock 'n' roll). 3rd ed. Los Angeles, Sage
Publ.
Finch, C. E./Crimmins, E. M. (2004). Inflammatory
exposure and historical changes in human life-spans. Science 305 (5691), 1736–1739.
https://doi.org/10.1126/science.1092556.
Floud, R./Fogel, R. W./Harris, B./Hong, S. C.
(2011). The changing body. Health, nutrition, and human development in the western world
since 1700. Cambridge/New York, Cambridge University Press.
Gardner, K. (2008). Keeping connected: security,
place, and social capital in a ‘Londoni’ village in Sylhet. Journal of the Royal
Anthropological Institute 14 (3), 477–495. https://doi.org/10.1111/j.1467-9655.2008.00513.x.
Gardner, K. (2021). Age, narrative and migration.
The life course and life histories of Bengali elders in London. [S.l.],
Routledge.
Goodman, A. H./Leatherman, T. L. (Eds.) (1998).
Building a new biocultural synthesis. Political-economic perspectives on human biology.
Ann Arbor, University of Michigan Press.
Gray, B. (2003). Social Exclusion, Poverty, Health
and Social Care in Tower Hamlets: The Perspectives of Families on the Impact of the
Family Support Service. British Journal of Social Work 33 (3), 361–380. https://doi.org/10.1093/bjsw/33.3.361.
Groth, D./Scheffler, C./Hermanussen, M. (2019).
Body height in stunted Indonesian children depends directly on parental education and
not via a nutrition mediated pathway - Evidence from tracing association chains by St.
Nicolas House Analysis. Anthropologischer Anzeiger 76 (5), 445–451. https://doi.org/10.1127/anthranz/2019/1027.
Guralnik, J. M./Ferrucci, L./Pieper, C.
F./Leveille, S. G./Markides, K. S./Ostir, G. V./Studenski, S./Berkman, L. F./Wallace, R.
B. (2000). Lower extremity function and subsequent disability: consistency across
studies, predictive models, and value of gait speed alone compared with the short
physical performance battery. The Journals of Gerontology. Series A, Biological Sciences
and Medical Sciences 55 (4), M221-31. https://doi.org/10.1093/gerona/55.4.m221.
Guralnik, J. M./Simonsick, E. M./Ferrucci,
L./Glynn, R. J./Berkman, L. F./Blazer, D. G./Scherr, P. A./Wallace, R. B. (1994). A
short physical performance battery assessing lower extremity function: association with
self-reported disability and prediction of mortality and nursing home admission. Journal
of Gerontology 49 (2), M85-94. https://doi.org/10.1093/geronj/49.2.m85.
Hayflick, L. (2007). Biological aging is no longer
an unsolved problem. Annals of the New York Academy of Sciences 1100, 1–13. https://doi.org/10.1196/annals.1395.001.
Hermanussen, M./Aßmann, C./Groth, D. (2021). Chain
Reversion for Detecting Associations in Interacting Variables-St. Nicolas House
Analysis. International Journal of Environmental Research and Public Health 18 (4).
https://doi.org/10.3390/ijerph18041741.
Hsu, C.-H./Posegga, O./Fischbach, K./Engelhardt,
H. (2021). Examining the trade-offs between human fertility and longevity over three
centuries using crowdsourced genealogy data. PloS one 16 (8), e0255528. https://doi.org/10.1371/journal.pone.0255528.
Jasienska, G. (2009). Reproduction and lifespan:
Trade-offs, overall energy budgets, intergenerational costs, and costs neglected by
research. American Journal of Human Biology 21 (4), 524–532. https://doi.org/10.1002/ajhb.20931.
Kuningas, M./Altmäe, S./Uitterlinden, A.
G./Hofman, A./van Duijn, C. M./Tiemeier, H. (2011). The relationship between fertility
and lifespan in humans. Age 33 (4), 615–622. https://doi.org/10.1007/s11357-010-9202-4.
Larke, A./Crews, D. E. (2006). Parental
investment, late reproduction, and increased reserve capacity are associated with
longevity in humans. Journal of Physiological Anthropology 25 (1), 119–131. https://doi.org/10.2114/jpa2.25.119.
Leitch, I. (1951). Growth and health. The British
Journal of Nutrition 5 (1), 142–151. https://doi.org/10.1079/BJN19510017.
Lockhart, P. A./Martin, P./Johnson, M.
A./Shirtcliff, E./Poon, L. W. (2017). The relationship of fertility, lifestyle, and
longevity among women. The Journals of Gerontology. Series A, Biological Sciences and
Medical Sciences 72 (6), 754–759. https://doi.org/10.1093/gerona/glw158.
Lohman, Timothy G./Roche, Alex F./Martorell,
Reynaldo (Eds.) (1988). Anthropometric standardization reference manual. Champaign,
Ill., Human Kinetics Books.
McEnry, M./Palloni, A. (2010). Early life
exposures and the occurrence and timing of heart disease among the older adult Puerto
Rican population. Demography 47 (1), 23–43. https://doi.org/10.1353/dem.0.0093.
Merrell, J./Kinsella, F./Murphy, F./Philpin,
S./Ali, A. (2005). Support needs of carers of dependent adults from a Bangladeshi
community. Journal of Advanced Nursing 51 (6), 549–557. https://doi.org/10.1111/j.1365-2648.2005.03539.x.
Mirowsky, J. (2005). Age at first birth, health,
and mortality. Journal of Health and Social Behavior 46 (1), 32–50. https://doi.org/10.1177/002214650504600104.
Nazroo, J. Y. (2004). Ethnic disparities in aging
health : what can we learn from the United Kingdom ? In: Norman B. Anderson/R. A.
Bulatao/B. Cohen (Eds.). Critical perspectives on racial and ethnic differences in
health in late life. Washington, D.C., National Academies Press.
NHANES III (1988). Body Measurements
(Anthropometry). Available online at https://www.cdc.gov/nchs/data/nhanes/nhanes3/cdrom/NCHS/MANUALS/ANTHRO.PDF
(accessed 11/3/2022).
Núñez-de la Mora, A./Bentley, G. R./Choudhury, O.
A./Napolitano, D. A./Chatterton, R. T. (2008). The impact of developmental conditions on
adult salivary estradiol levels: why this differs from progesterone? American Journal of
Human Biology 20 (1), 2–14. https://doi.org/10.1002/ajhb.20698.
Núñez-de la Mora, A./Chatterton, R. T./Choudhury,
O. A./Napolitano, D. A./Bentley, G. R. (2007). Childhood conditions influence adult
progesterone levels. PLoS medicine 4 (5), e167. https://doi.org/10.1371/journal.pmed.0040167.
Peach, Ceri (Ed.) (1996). Ethnicity in the 1991
census. The ethnic minority populations of Britain, vol. 2. London,
HMSO.
Phillipson, C./Ahmed, N. R./Latimer, J. (2004).
Women in transition. A study of the experiences of Bangladeshi women living in Tower
Hamlets. Bristol, Policy Press University of Bristol.
Prince, M./Acosta, D./Dangour, A. D./Uauy,
R./Guerra, M./Huang, Y./Jacob, K. S./Rodriguez, J. J. L./Salas, A./Sosa, A. L./Williams,
J. D./Acosta, I./Albanese, E./Dewey, M. E./Ferri, C. P./Stewart, R./Gaona,
C./Jotheeswaran, A. T./Kumar, P. S./Li, S./Guerra, J. C. L./Rodriguez, D./Rodriguez, G.
(2011). Leg length, skull circumference, and the prevalence of dementia in low and
middle income countries: a 10/66 population-based cross sectional survey. International
Psychogeriatrics 23 (2), 202–213. https://doi.org/10.1017/S1041610210001274.
Prothro, J. W./Rosenbloom, C. A. (1993). Physical
measurements in an elderly black population: knee height as the dominant indicator of
stature. Journal of Gerontology 48 (1), M15-8. https://doi.org/10.1093/geronj/48.1.m15.
R Development Core Team (2022). R Development Core
Team. Available online at https://www.cmswire.com/d/r-development-core-team-o001141 (accessed
8/27/2021).
Roubenoff, R./Wilson, P. W. (1993). Advantage of
knee height over height as an index of stature in expression of body composition in
adults. The American Journal of Clinical Nutrition 57 (5), 609–613. https://doi.org/10.1093/ajcn/57.5.609.
Scholl, T. O./Hediger, M. L./Schall, J. I. (1997).
Maternal growth and fetal growth: pregnancy course and outcome in the Camden Study.
Annals of the New York Academy of Sciences 817, 292–301. https://doi.org/10.1111/j.1749-6632.1997.tb48215.x.
Shirley, M. K./Arthurs, O. J./Seunarine, K.
K./Cole, T. J./Eaton, S./Williams, J. E./Clark, C. A./Wells, J. C. K. (2022).
Implications of leg length for metabolic health and fitness. Evolution, Medicine, and
Public Health 10 (1), 316–324. https://doi.org/10.1093/emph/eoac023.
Spence, N. J. (2008). The Long-Term Consequences
of Childbearing: Physical and Psychological Well-Being of Mothers in Later Life.
Research on Aging 30 (6), 722–751. https://doi.org/10.1177/0164027508322575.
Sproston, Kerry/Mindell, Jennifer (2006). Health
survey for England 2004: the health of ethnic minority groups. Available online at
https://files.digital.nhs.uk/publicationimport/pub01xxx/pub01170/hea-surv-ethn-min-eng-2004-rep-v3.pdf
(accessed 11/3/2022).
Stearns, S. C. (2004). The evolution of life
histories. Oxford, Oxford University Press.
Stinson, Sara/Bogin, Barry/O'Rourke, Dennis (Eds.)
(2012). Human biology. An evolutionary and biocultural perspective. 2nd ed. Hoboken, NJ,
Wiley-Blackwell.
Tanner, J. M. (1987). Growth as a mirror of the
condition of society: secular trends and class distinctions. Acta Paediatrica Japonica :
Overseas Edition 29 (1), 96–103. https://doi.org/10.1111/j.1442-200X.1987.tb00015.x.
Thayer, Z. M./Kuzawa, C. W. (2011). Biological
memories of past environments: epigenetic pathways to health disparities. Epigenetics 6
(7), 798–803. https://doi.org/10.4161/epi.6.7.16222.
Thompson, J. (2013). Migration, nutrition and
ageing across the lifecourse in Bangladeshi families: a transnational perspective,
2009-2012. UK Data Service, SN: 6781. https://doi.org/10.5255/UKDA-SN-6781-1.
Thompson, J. L./Bogin, B./Garaj, V./Heinrich,
M./Meier, P./Merrell, J. (2012). Migration, nutrition and ageing across the lifecourse
in Bangladeshi families: a transnational perspective (MINA). Available online at
https://www.birmingham.ac.uk/Documents/college-social-sciences/social-policy/iris/2014/NDA-Findings-17-FINAL.pdf
(accessed 11/3/2022).
Varea, C./Bernis, C. (2013). Encephalization,
reproduction and life history. Human Evolution 28 (1-2), 1–16.
Victor, C. R./Burholt, V./Martin, W. (2012).
Loneliness and ethnic minority elders in Great Britain: an exploratory study. Journal of
cross-cultural Gerontology 27 (1), 65–78. https://doi.org/10.1007/s10823-012-9161-6.
Wang, D. X. M./Yao, J./Zirek, Y./Reijnierse, E.
M./Maier, A. B. (2020). Muscle mass, strength, and physical performance predicting
activities of daily living: a meta-analysis. Journal of Cachexia, Sarcopenia and Muscle
11 (1), 3–25. https://doi.org/10.1002/jcsm.12502.
Westendorp, R. G./Kirkwood, T. B. (1998). Human
longevity at the cost of reproductive success. Nature 396 (6713), 743–746. https://doi.org/10.1038/25519.
Wit, J.-M./Boersma, B. (2002). Catch-up growth:
definition, mechanisms, and models. Journal of Pediatric Endocrinology & Metabolism
15 Suppl 5, 1229–1241. Available online at https://www.ncbi.nlm.nih.gov/pubmed/12510974.
World Bank (2022). World Bank Open Data. Available
online at https://data.worldbank.org/
(accessed 11/3/2022).